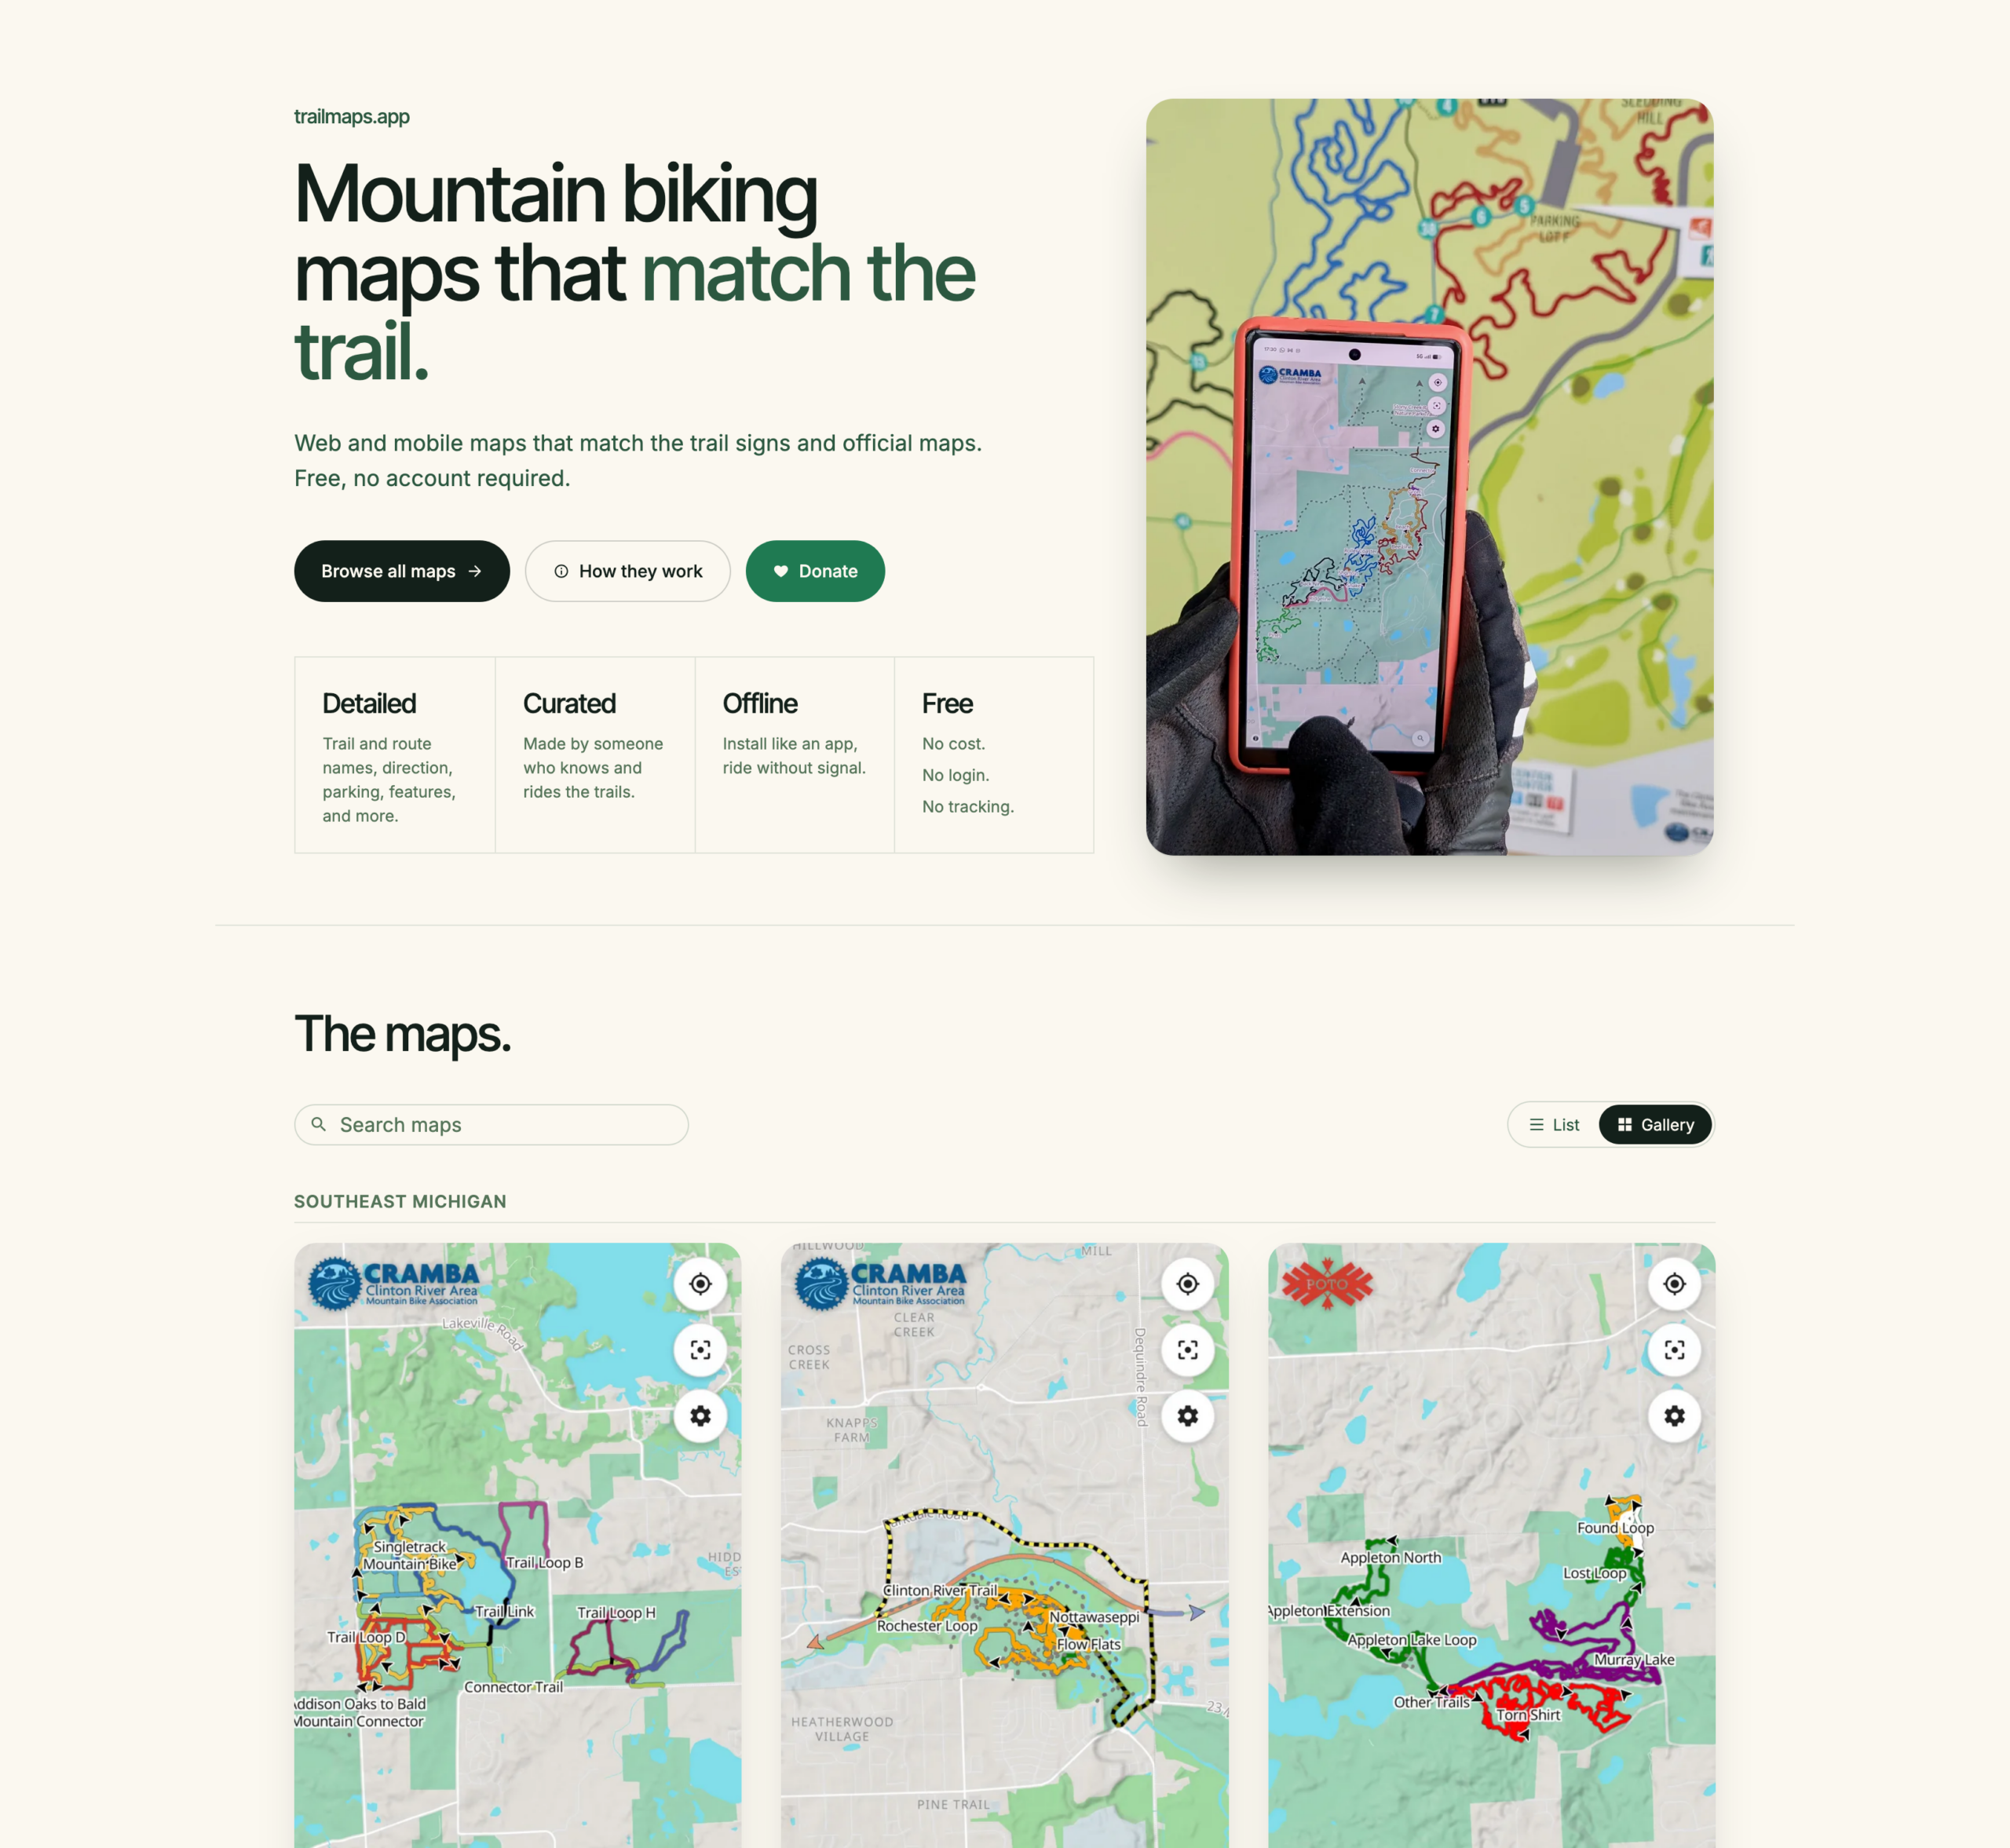
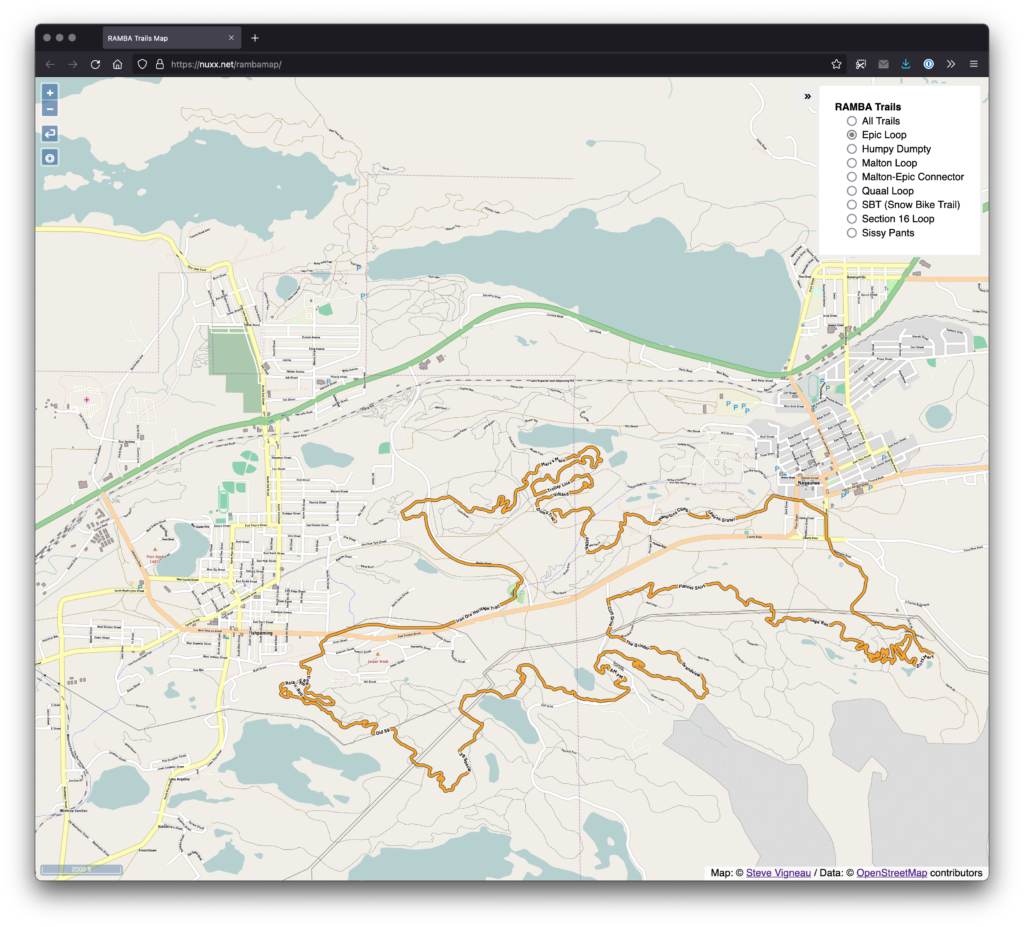
I’ve been using it for a while now, so I guess it’s a good time to announce the revamp / relaunch / whatever of trailmaps.app. This is a personal project website which started one frosty January morning as I sat in an Ishpeming rental waiting for temps to rise before heading out on a fatbike ride and is now a hub for hosting maps I’ve generated of various trail systems.
The root of the idea was cooked up on a long drive; I wanted something akin to the subway-map-style’d official RAMBA print map (parallel lines over a single trail to illustrate the trail’s membership in multiple routes), but web based. And maybe usable on a phone. And after the early learning then quite a bit of work this spring… Here it is.
Instead of just doing a single map (one-map-at-a-time coding / tile generation / etc) as I had in the past, I now have a full-on map generator that takes data from OSM and other online/open/free sources, combines it all, and generates static content that’s easy to host and cachable so it works if a device loses cell service. It’s basically as close to an app as one can get while still staying web-based.
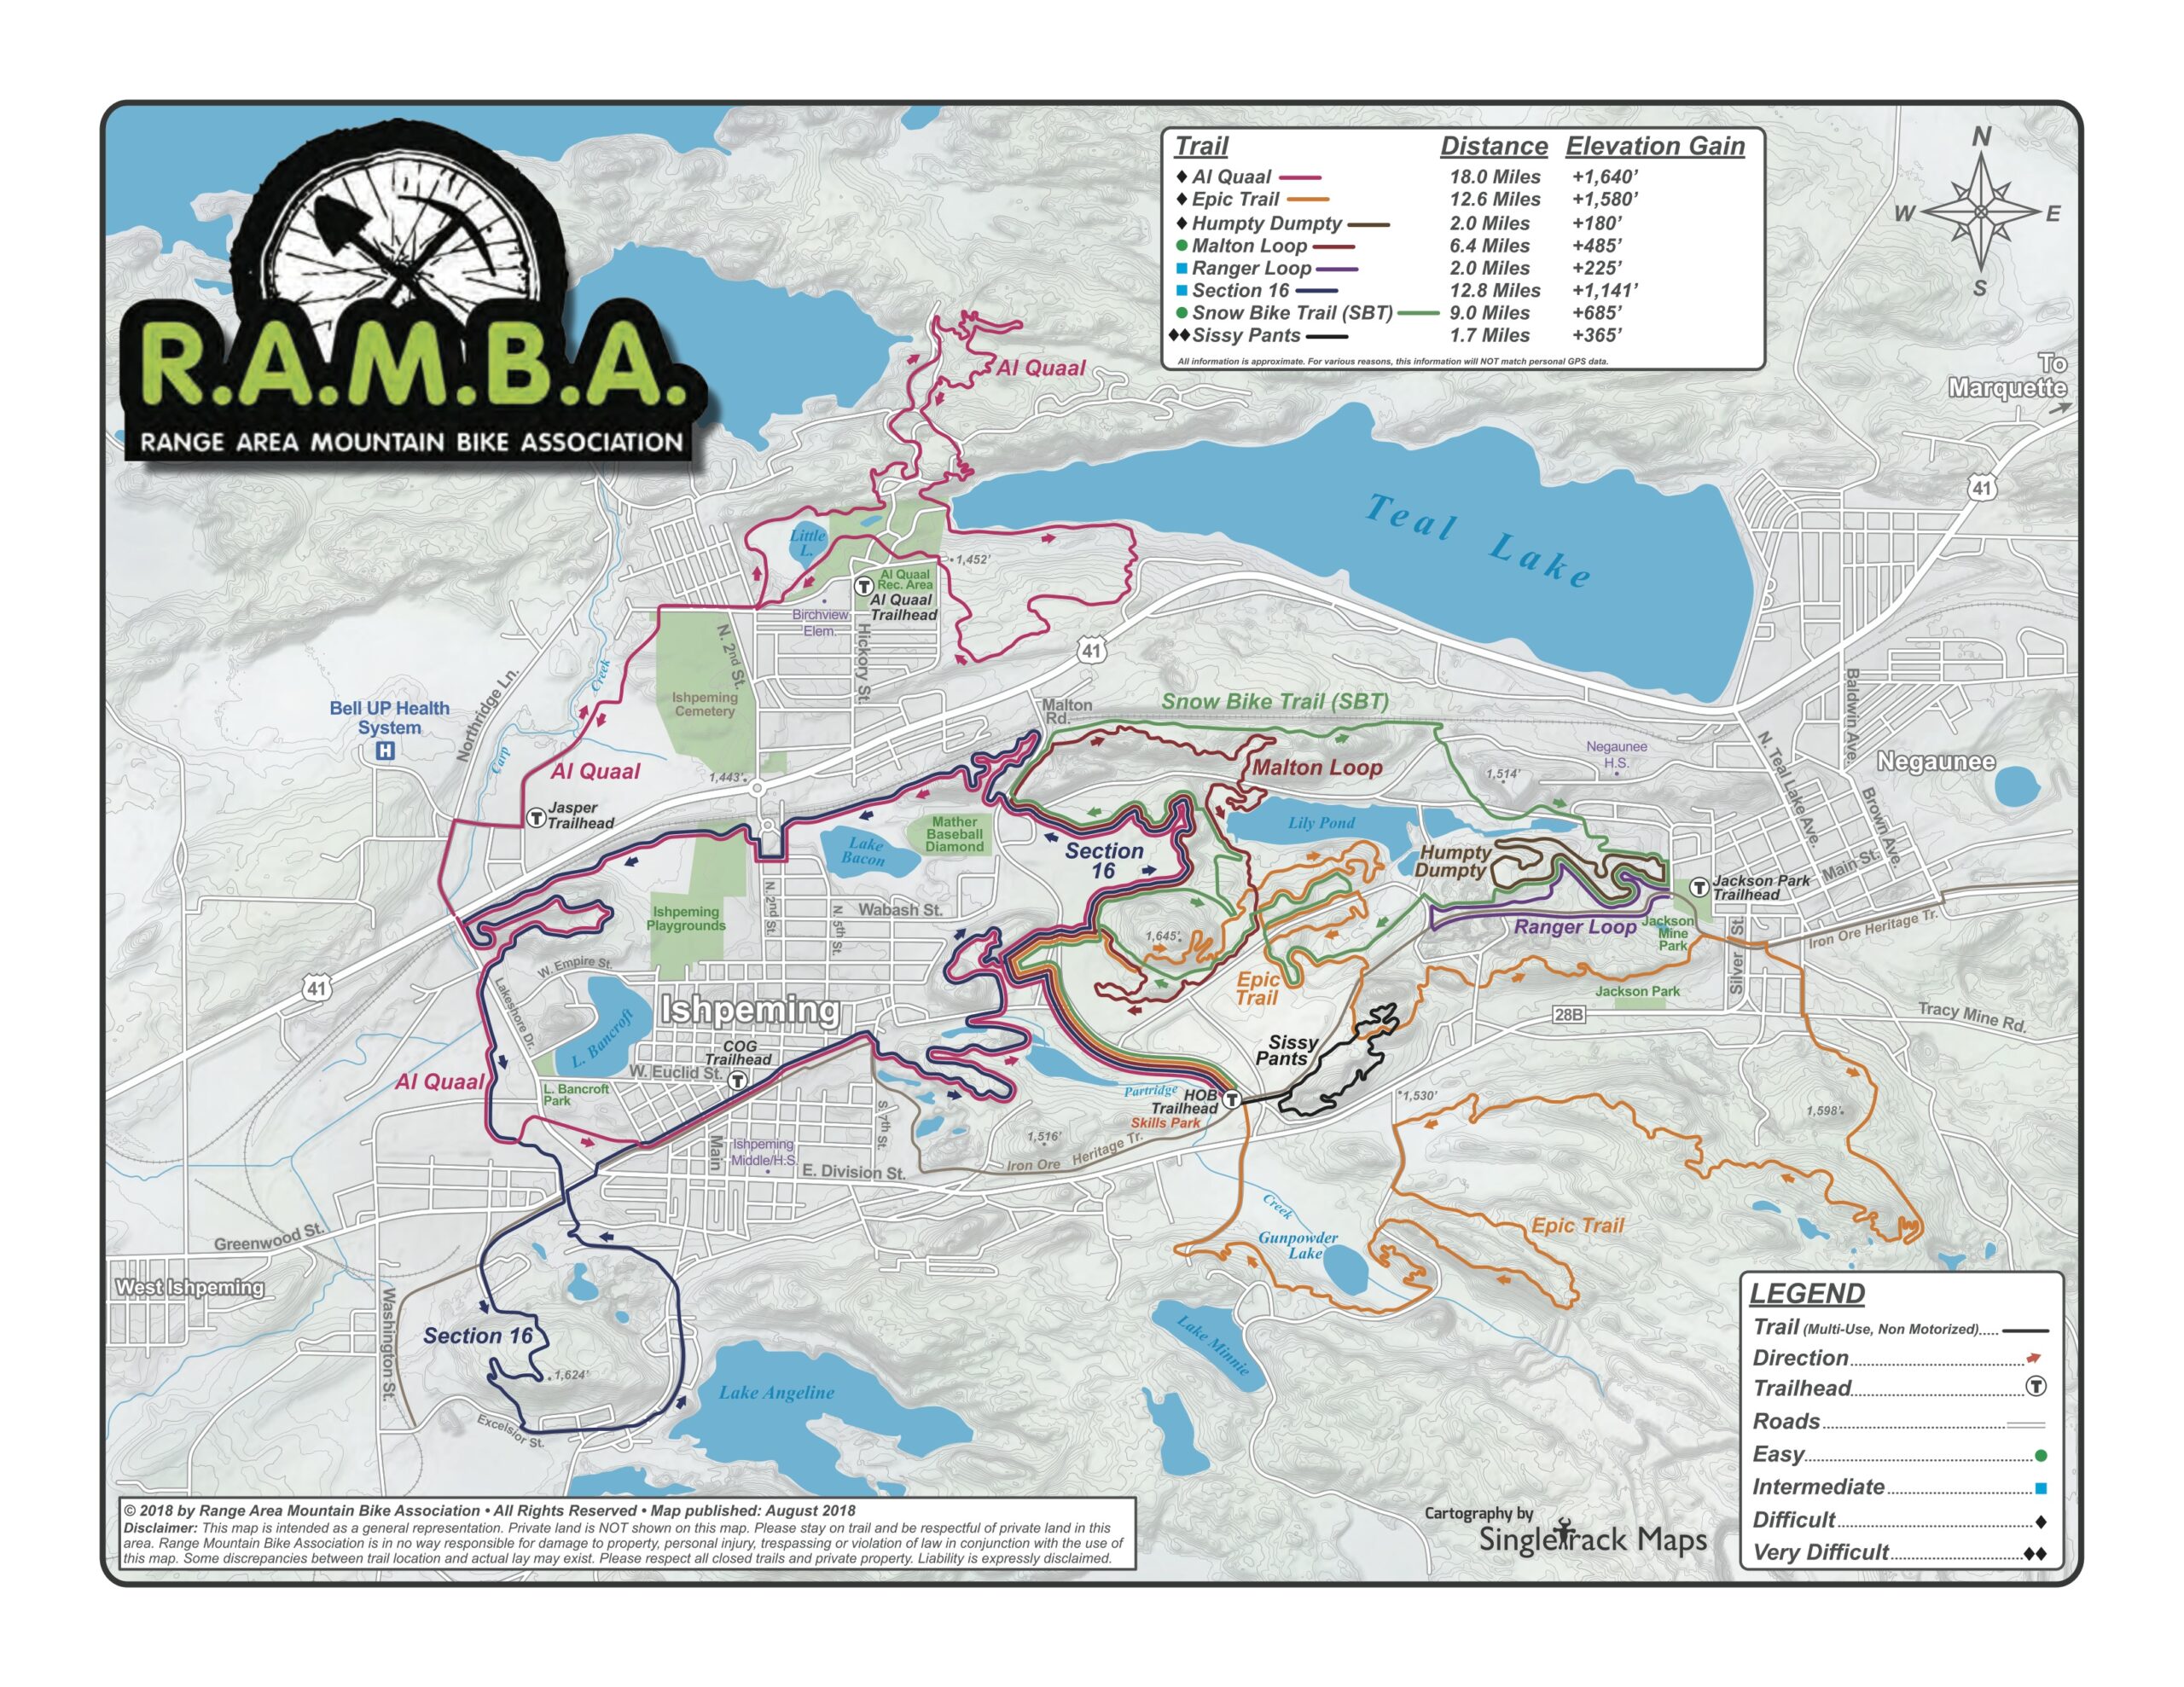
By being hand-curated (that is, not just auto-generated off of all OSM data) these maps also fill a long-standing gap with other online maps (eg: Trailforks, MTB Project, Strava, RideWithGPS) in that they don’t style (color) the routes the way official park maps and signage do, making what a rider sees on their phone challenging to align with what they see on a signpost next to a trail.
There’s a bunch more features that this brought about, which I won’t dive into as much depth, but which I’m still quite proud / happy with. The end results are what I want in maps, and it’s nicely reusable:
Reusable map generation engine; I write a YAML description of the map (title, OSM references, info that can’t be found in OSM) and it makes the map. If the engine or data gets updated, re-run the map and/or website generation tools.
PWA (Progressive Web Apps), so they are installable app-ish, but without the app store overhead.
OSM data is not fetched live — it’s a snapshot taken map-generation time — meaning errant edits don’t break the map.
Zero user/usage tracking, including having all assets loaded from trailmaps.app. (I’m trying to support less and less online tracking while still providing a good tool.)
Ability to generate maps custom from non-OSM data, such as race or group ride routes.
Thorough, proper (read: non-shady) SEO such as OpenGraph previews and metadata, making link embedding, sharing, and site discovery by search engines work well.
Hostable for cheap since the only server requirements are TLS and RANGE requests. A $5/mo Nanode from Akamai (formerly Linode) easily does it all.
Stand-alone maps (each map is a self-contained site) makes it possible for them to be hosted elsewhere, such as if one was made for a trail club/org, etc.
And yes, I heavily used AI-assisted development for this. It was quite educational as since I knew the inputs and outputs, use the maps myself, and was able to do quite a bit of QA, the result is great. At my day job in IT there is (as typical) a huge emphasis in using AI tooling to assist us with our work. This served as a nights-and-weekends project that was quite educational and will benefit me in day-job stuff while achieving a personal goal of making something I wanted and useful for others. It also illustrated the interesting balance between what AI-generation is good at (code, bug finding) and what it’s not (wording, stylistic choices that aren’t simple clones, avoiding feature bloat).
I’m subsequently making the map generator itself available under the MIT license so others can use it. I do have an extensive toolchain for generating the website (takes a definition file and generates the maps, creates preview images, updates the index, rsync’s it to the server) but that part is staying closed / non-released because it’s very my-setup-specific.
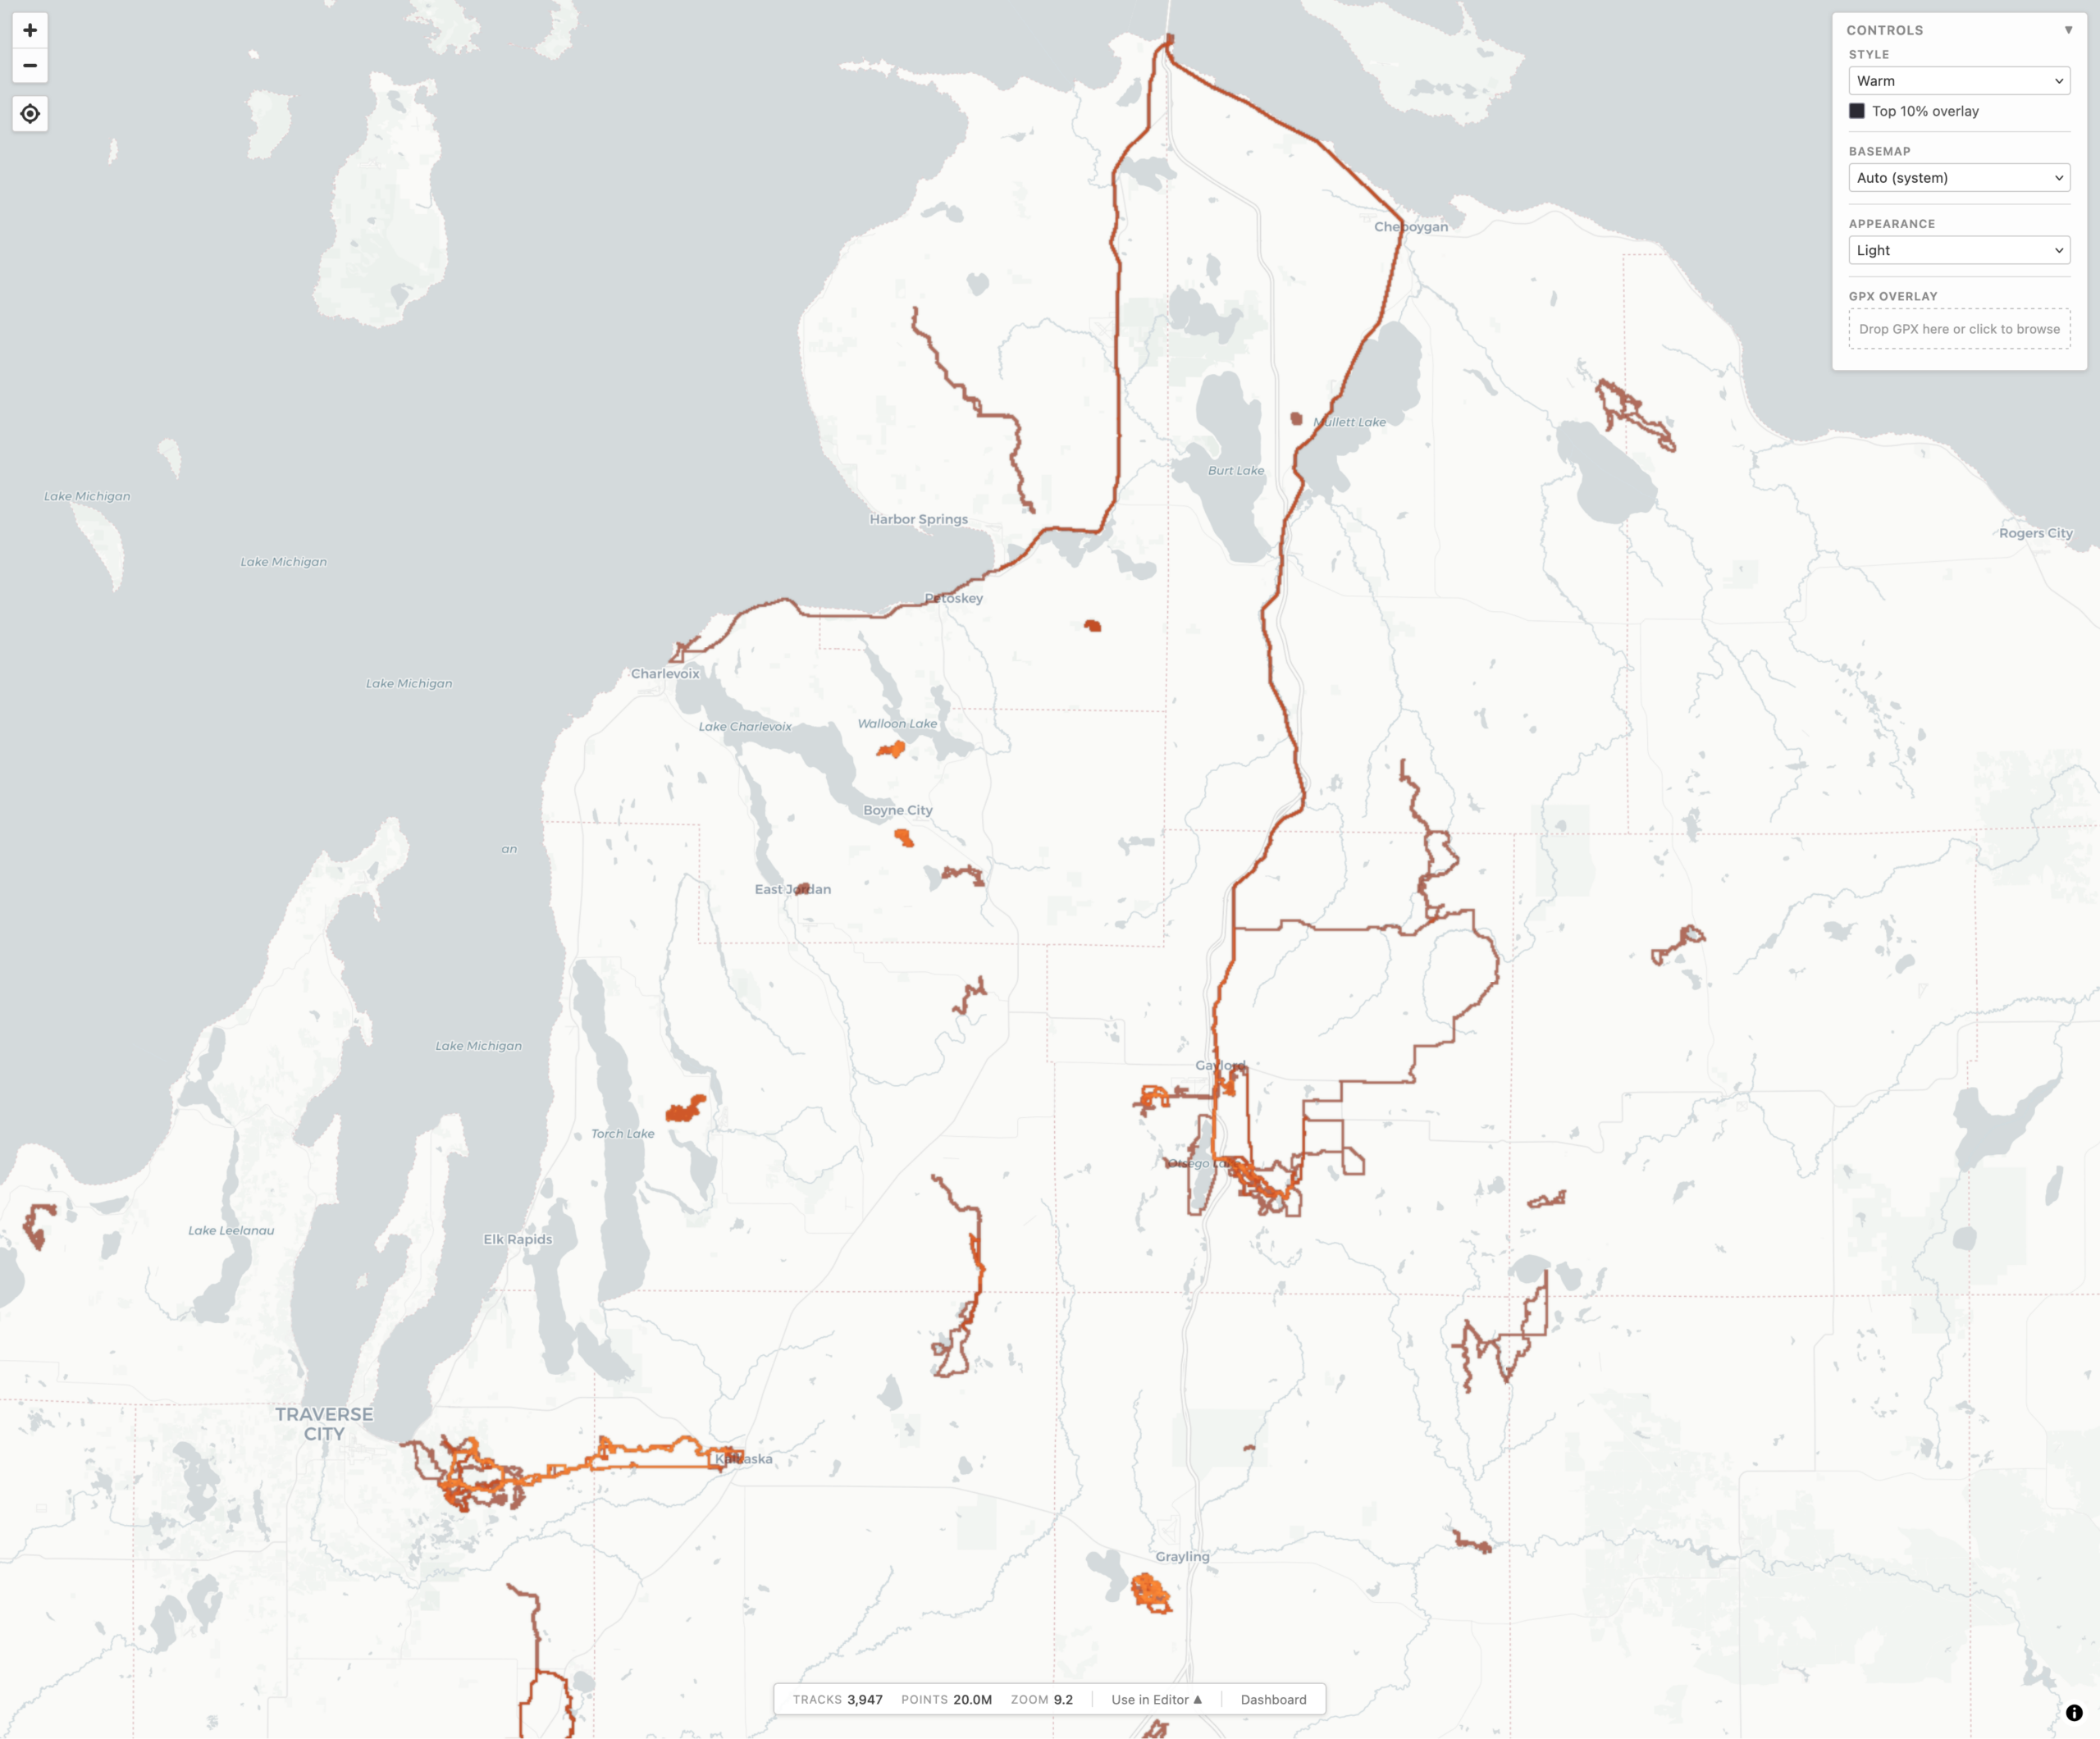
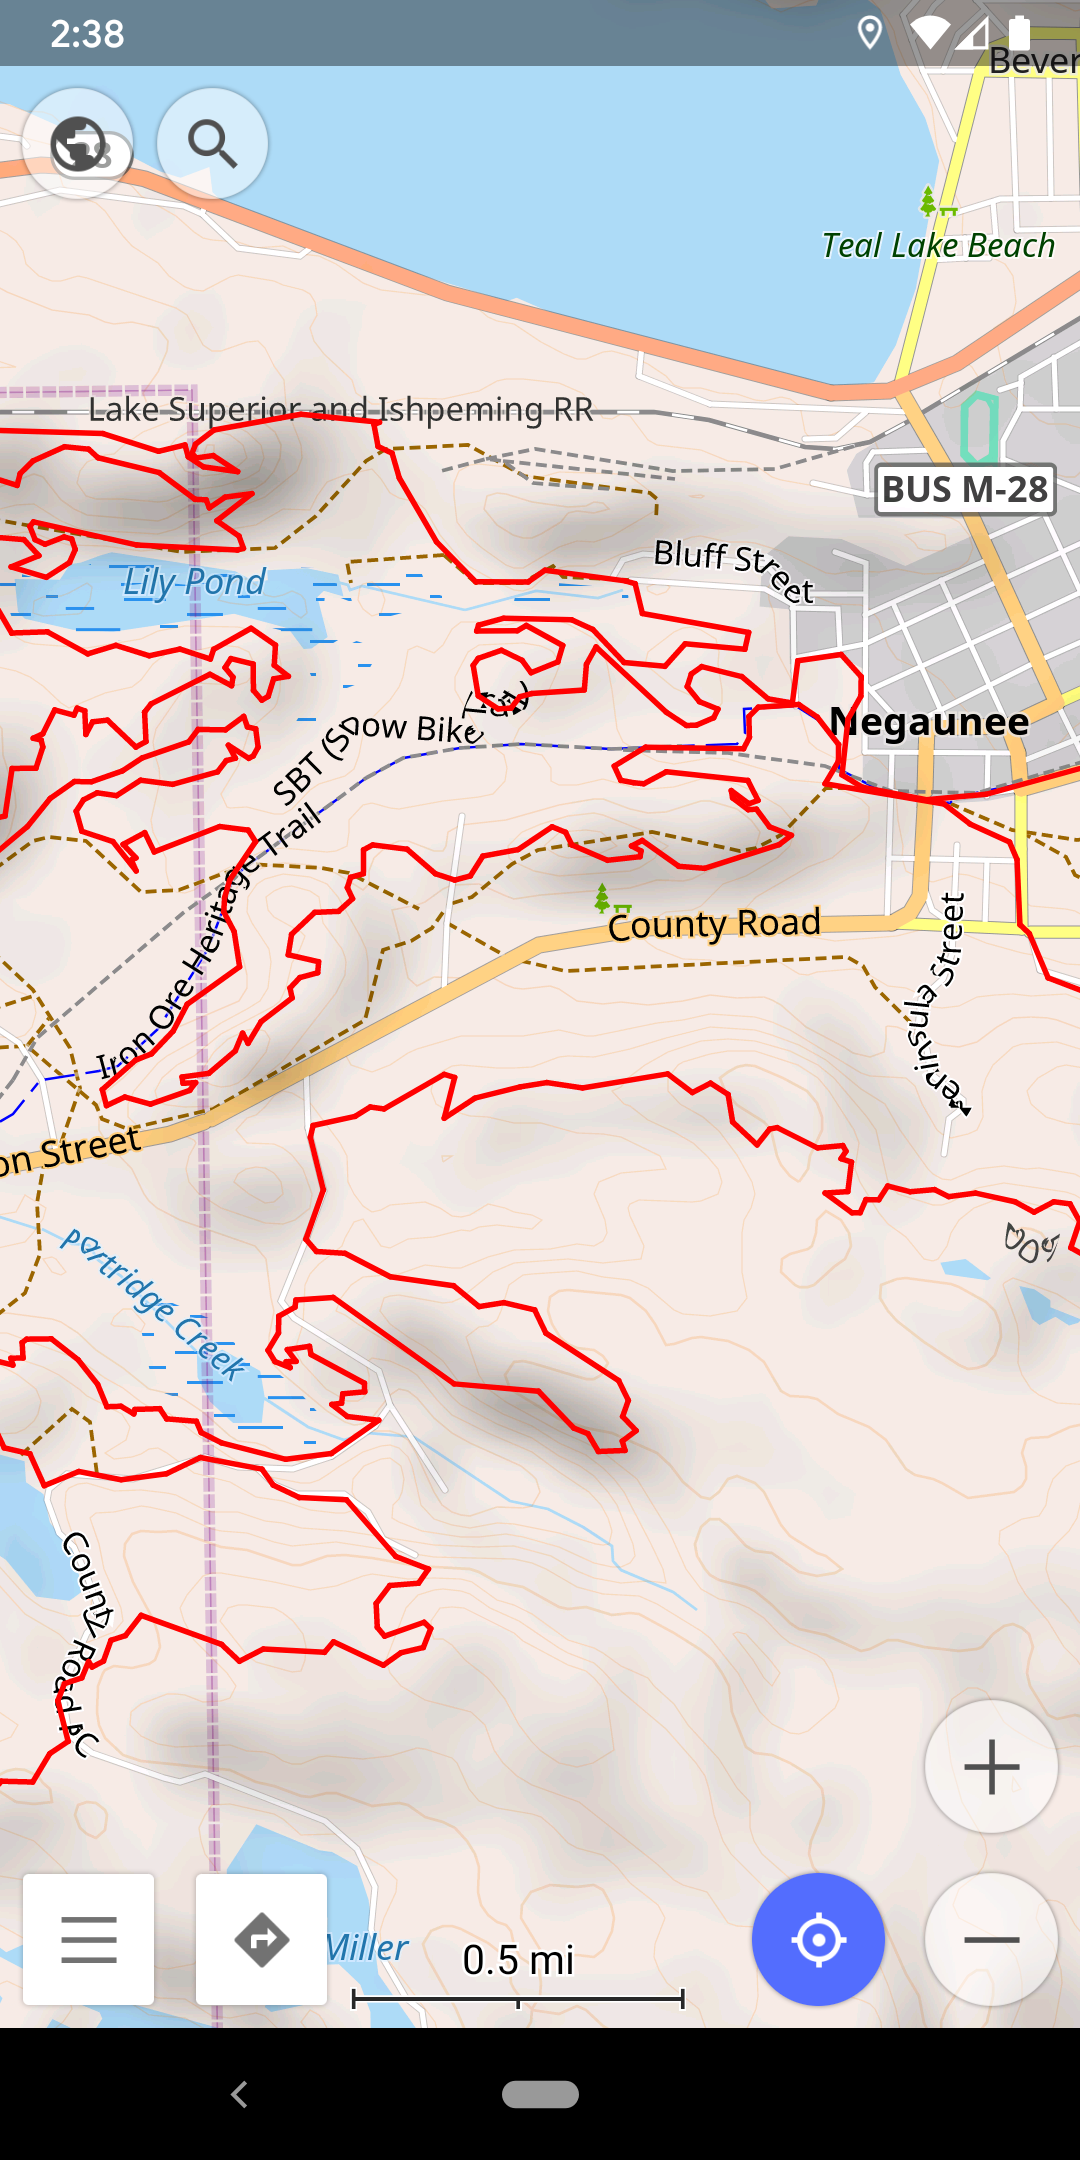
local-heatmap-tile-server v1 showing Northern Michigan in Warm style and Light appearance.
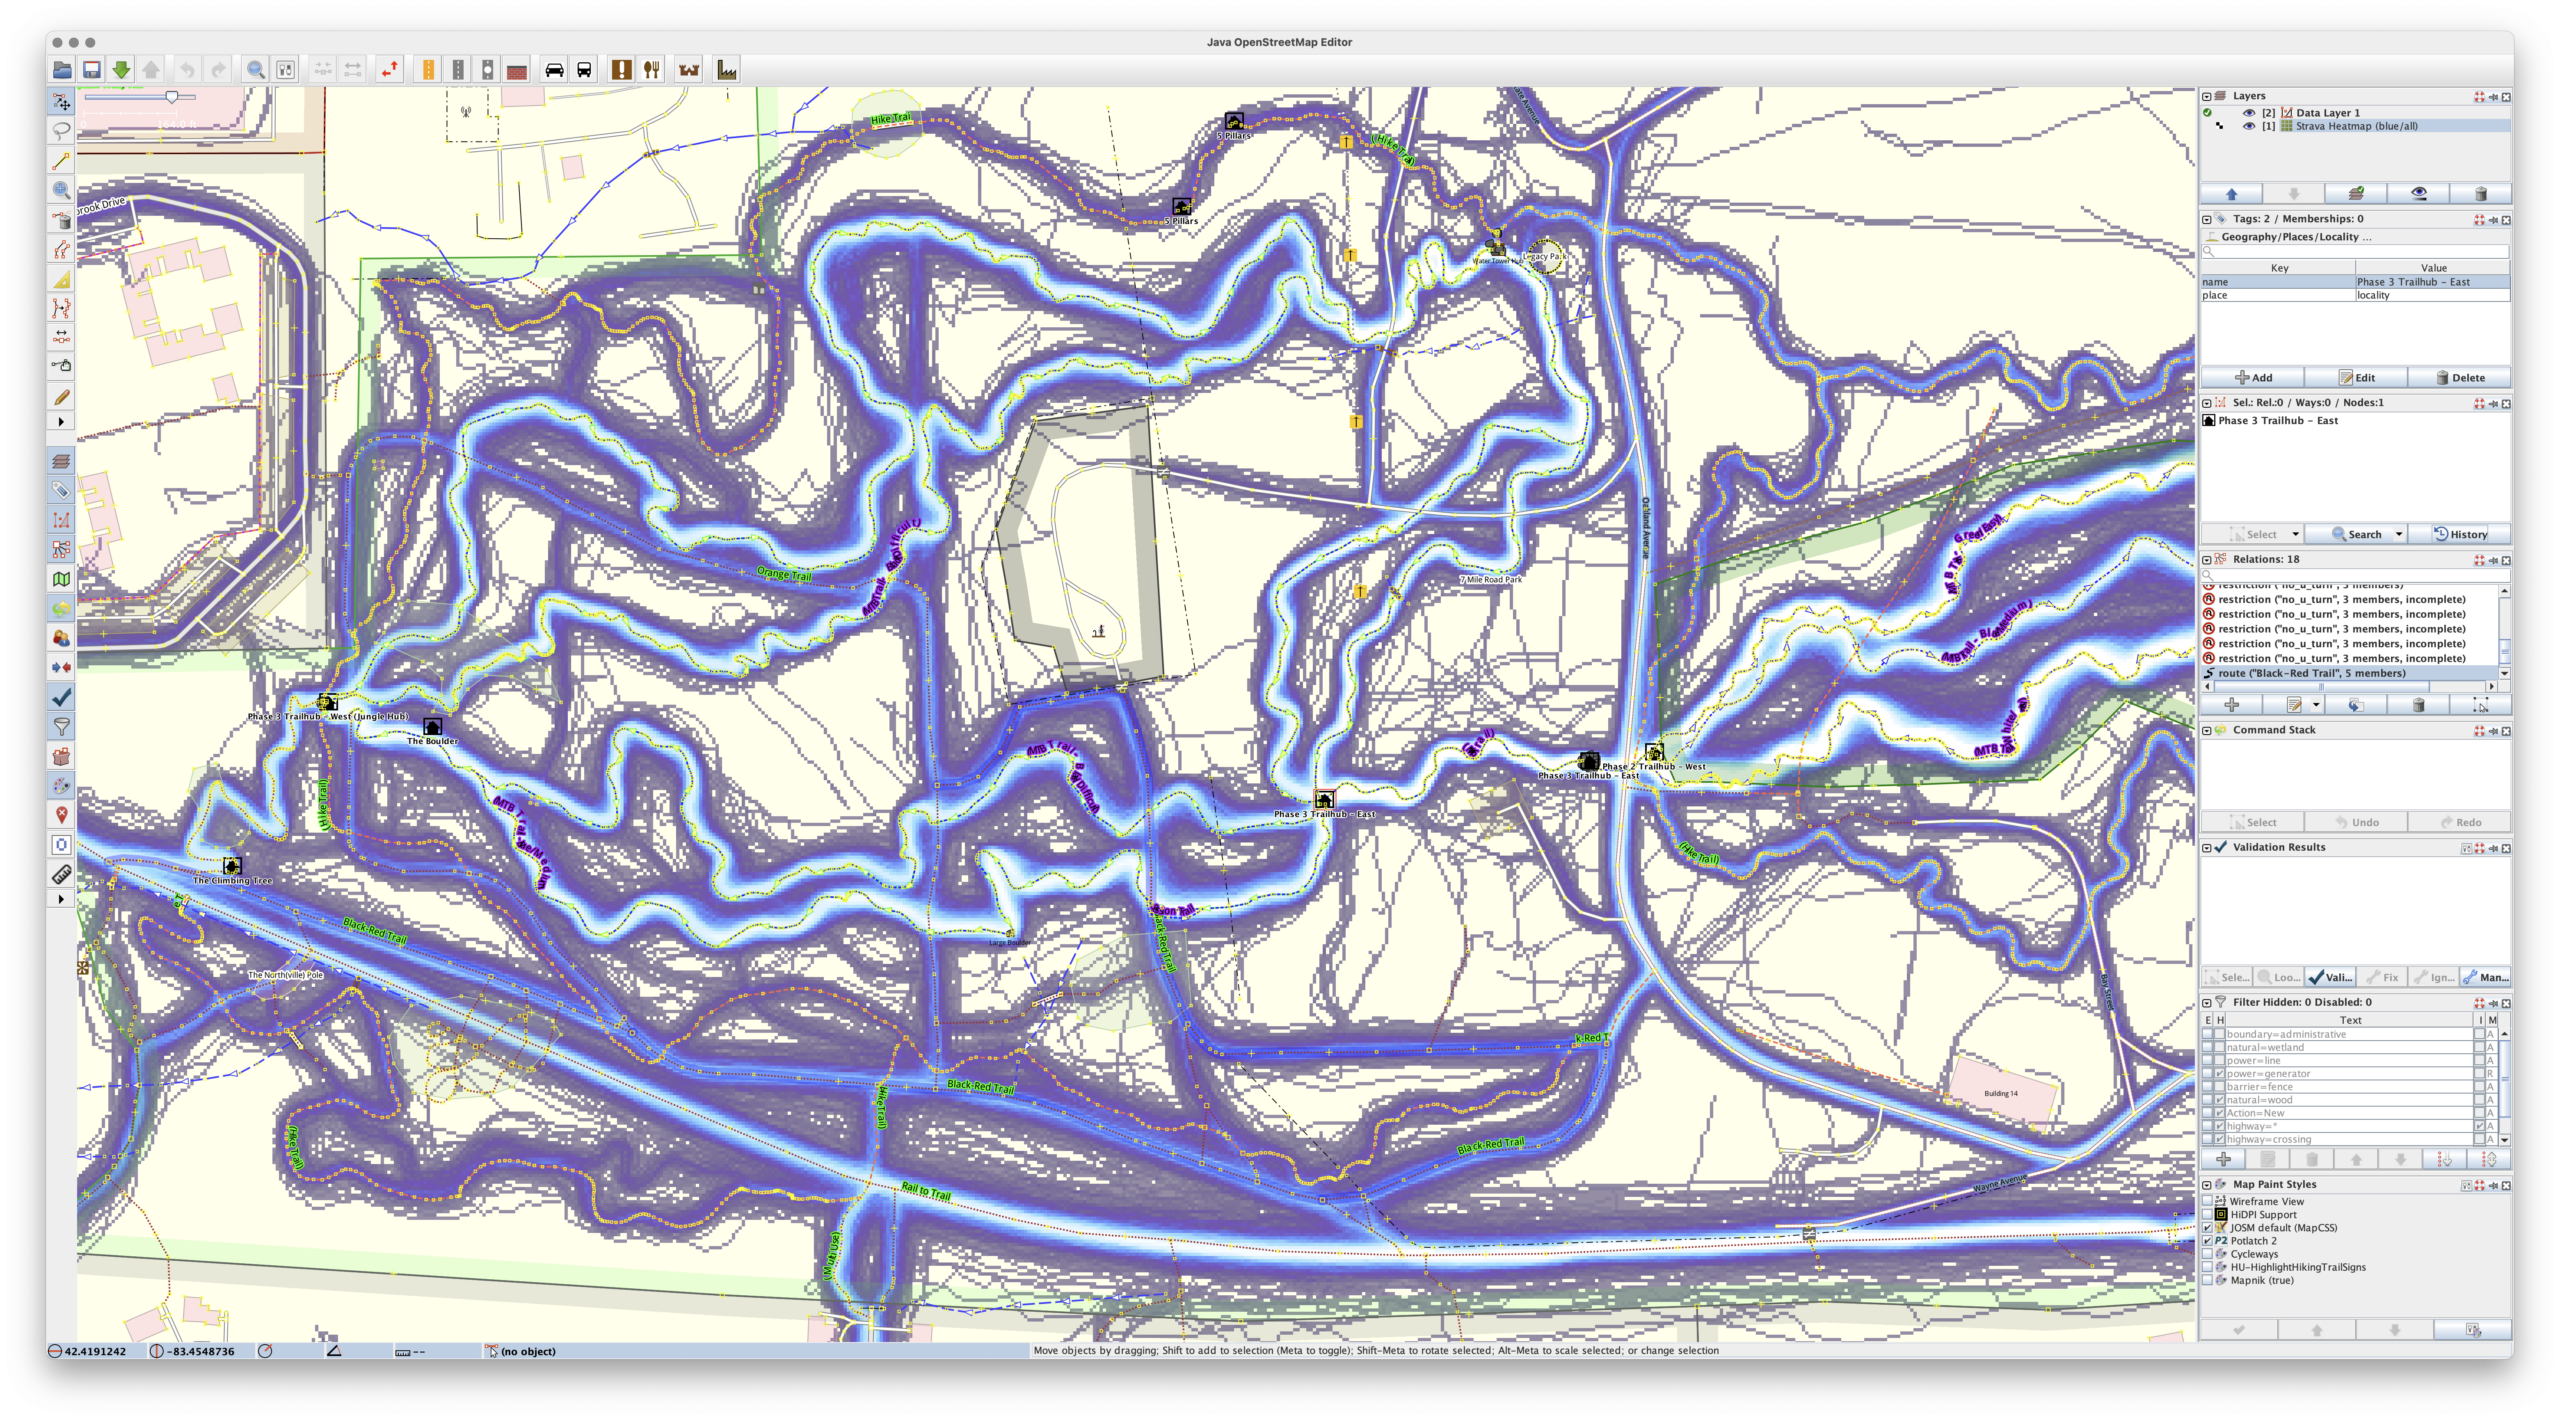
During a long drive to (and from) Florida, and a lot of thinking about maps, I realized something that I really wanted, and something that I could use AI-assisted development to experiment with: generating a heatmap from all my personal, archived activity files. Specifically, generating XYZ tiles, making them available via TMS (so they can be used as an imagery layer in JOSM), and also displaying them on a slippy map.
For years I’ve been using the Strava heatmap as a layer in JOSM for OpenStreetMap (OSM) editing and this works great, but I’m finding myself disconnecting from online social networks, including Strava, more and more. And while the Strava Global heatmap does work as a data layer with a free account, I began thinking about other options to use it, and other cloud providers, less and less. And yes, there’s similar offerings from RideWithGPS and whatnot, but I really wanted to generate my own since it’d give me a lot more flexibility.
So, for my next project working with Claude, I decided to try building a personal heatmap generation tool. And it worked.
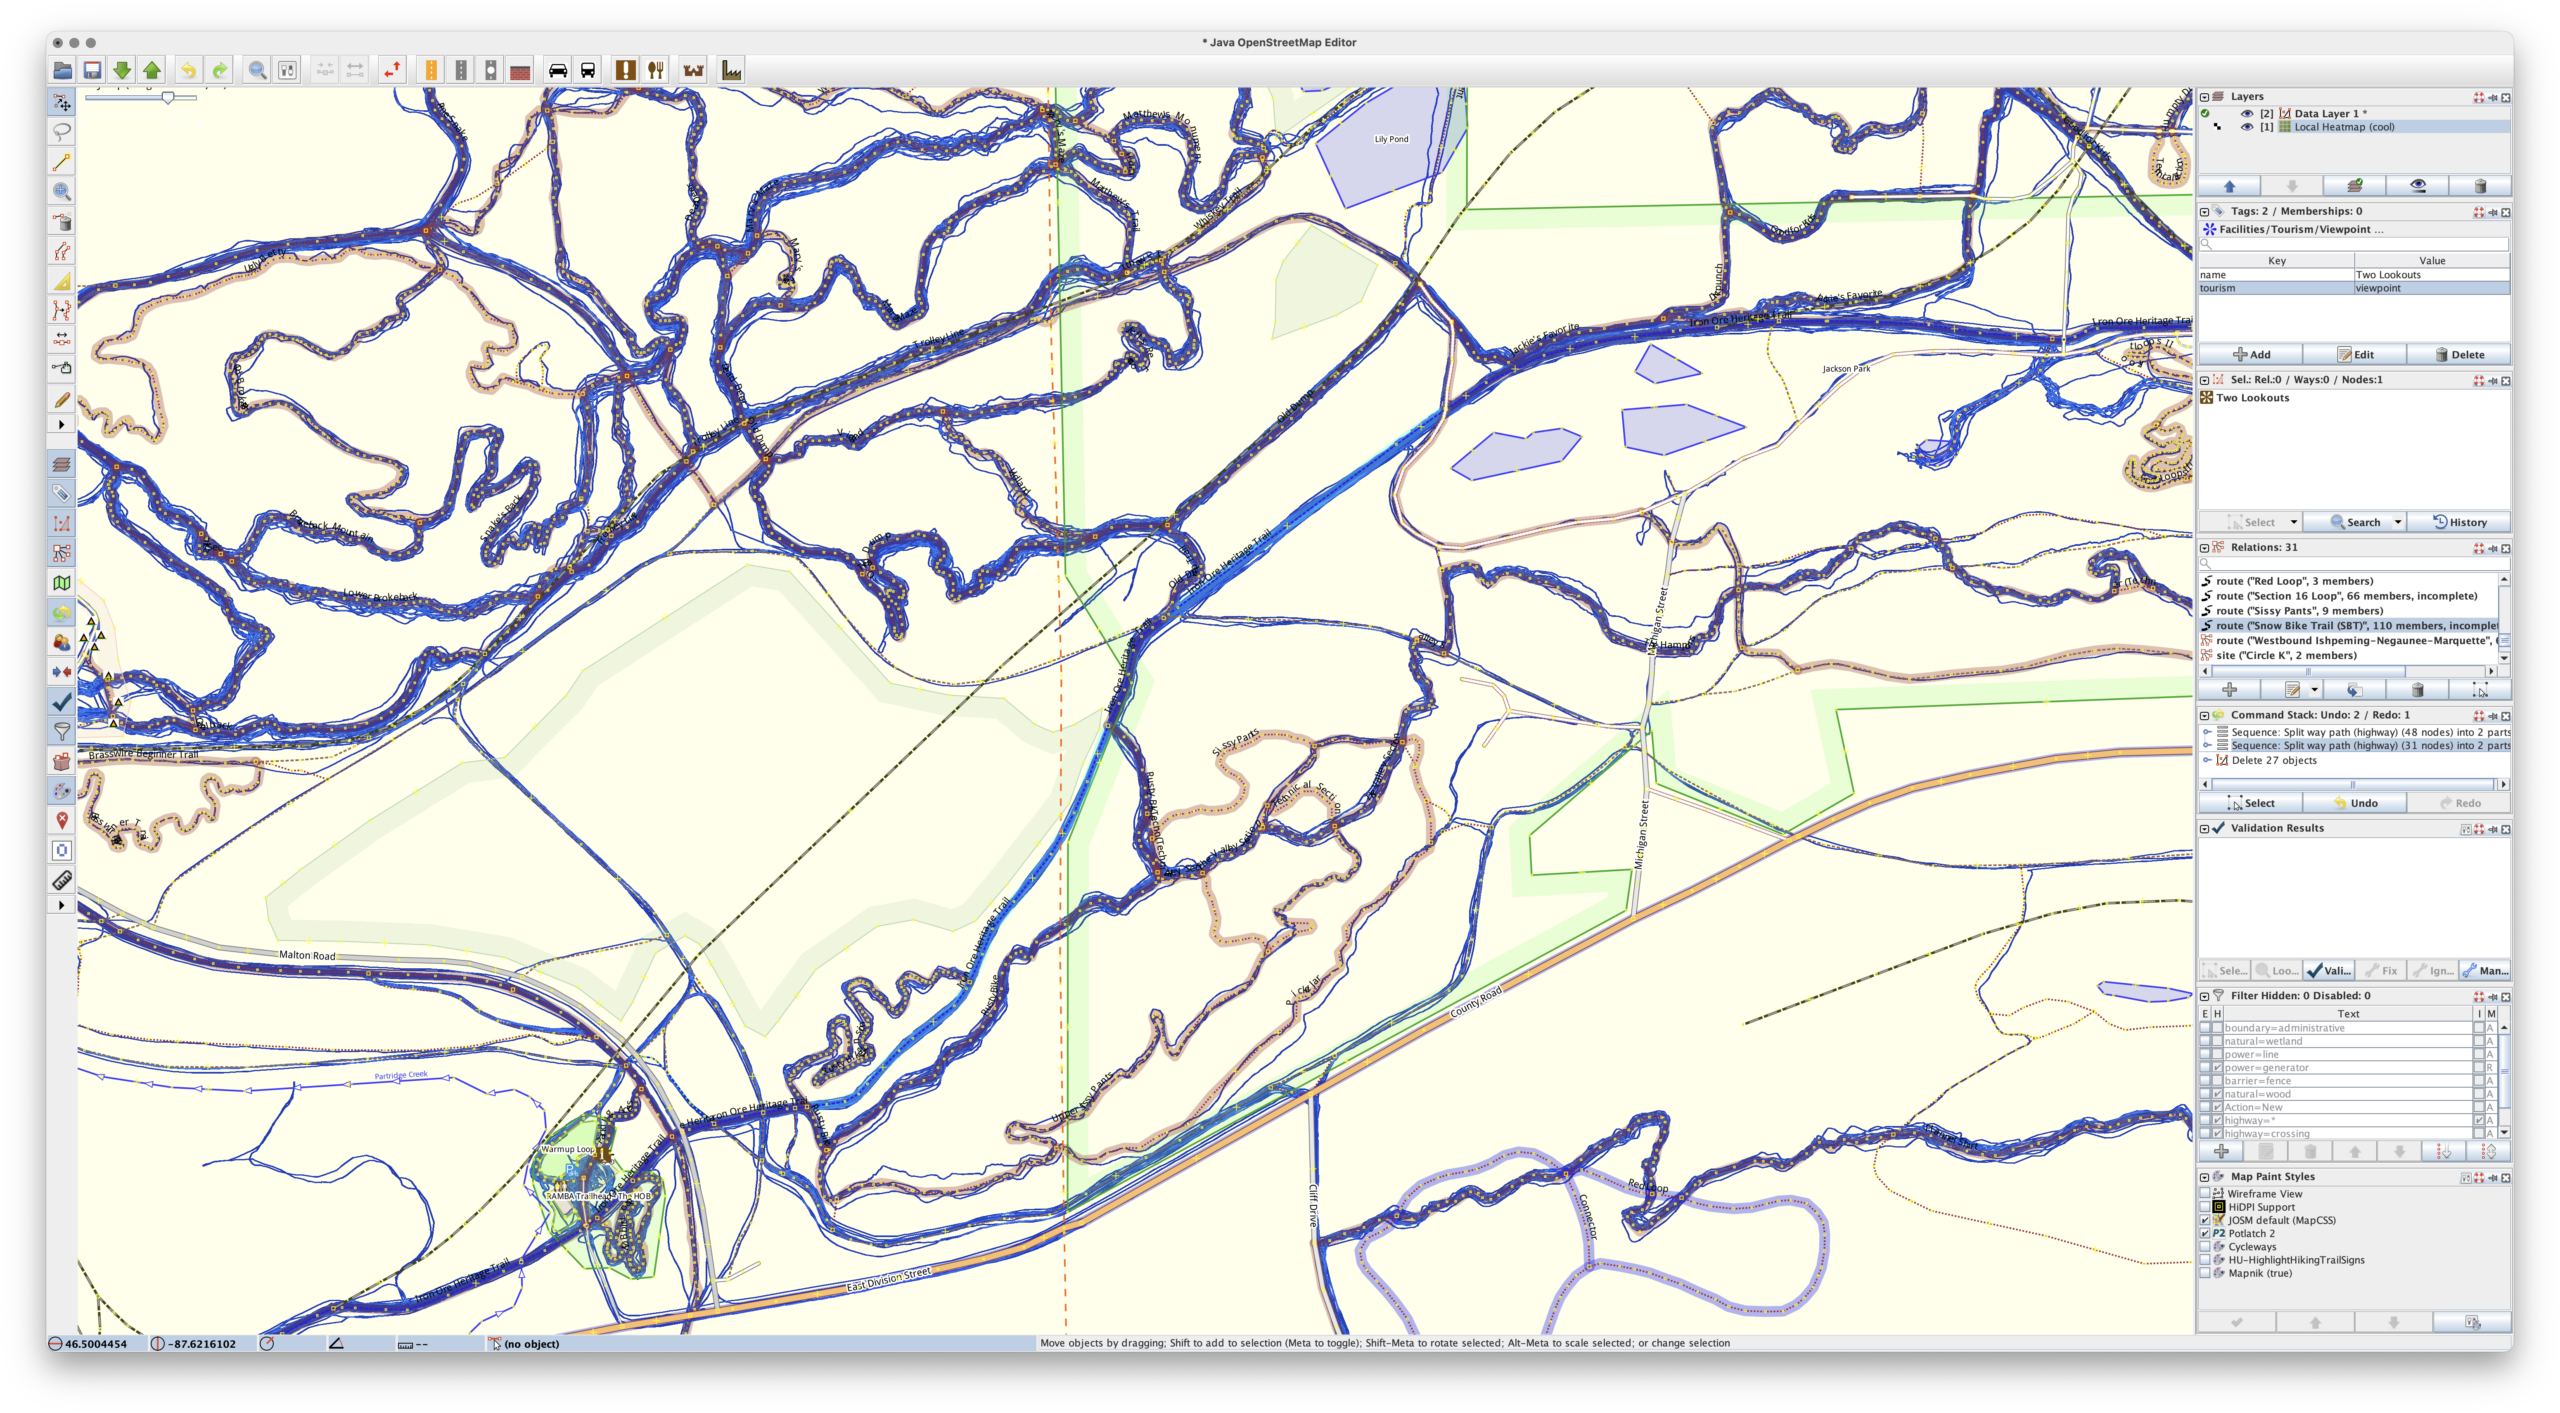
Cool heatmap of my ride and hike data, used as a layer in JOSM. (Ishpeming/Negaunee area.)
Using AI tools to develop software is nothing new, but I’ve never really been one to jump right on brand-new things, instead waiting for them to bake and show their utility before I dig in and use/learn them. I also find it very difficult to learn any tool or system unless I have a way to apply it. But when I do, getting my head around it comes pretty quickly.
In making this I’ve learned / found / finally-realized that with a known set of inputs, a desired output, an ability to identify/recognize bugs, and a task that’s known-possible, AI-assisted development saves can save incredible amount of time. Within reason it makes it possible for me to be more of a product manager than developer. Since I’m not really a developer (my career is in systems management and troubleshooting), that work for me is slow… and I’m not good at it.
Using Claude on the desktop to write the code, VS Code to read and make a few manual edits, and Docker Desktop so I could keep an eye on things, after about a week of free-time iterating, this is what I came up with, and I’m quite pleased:
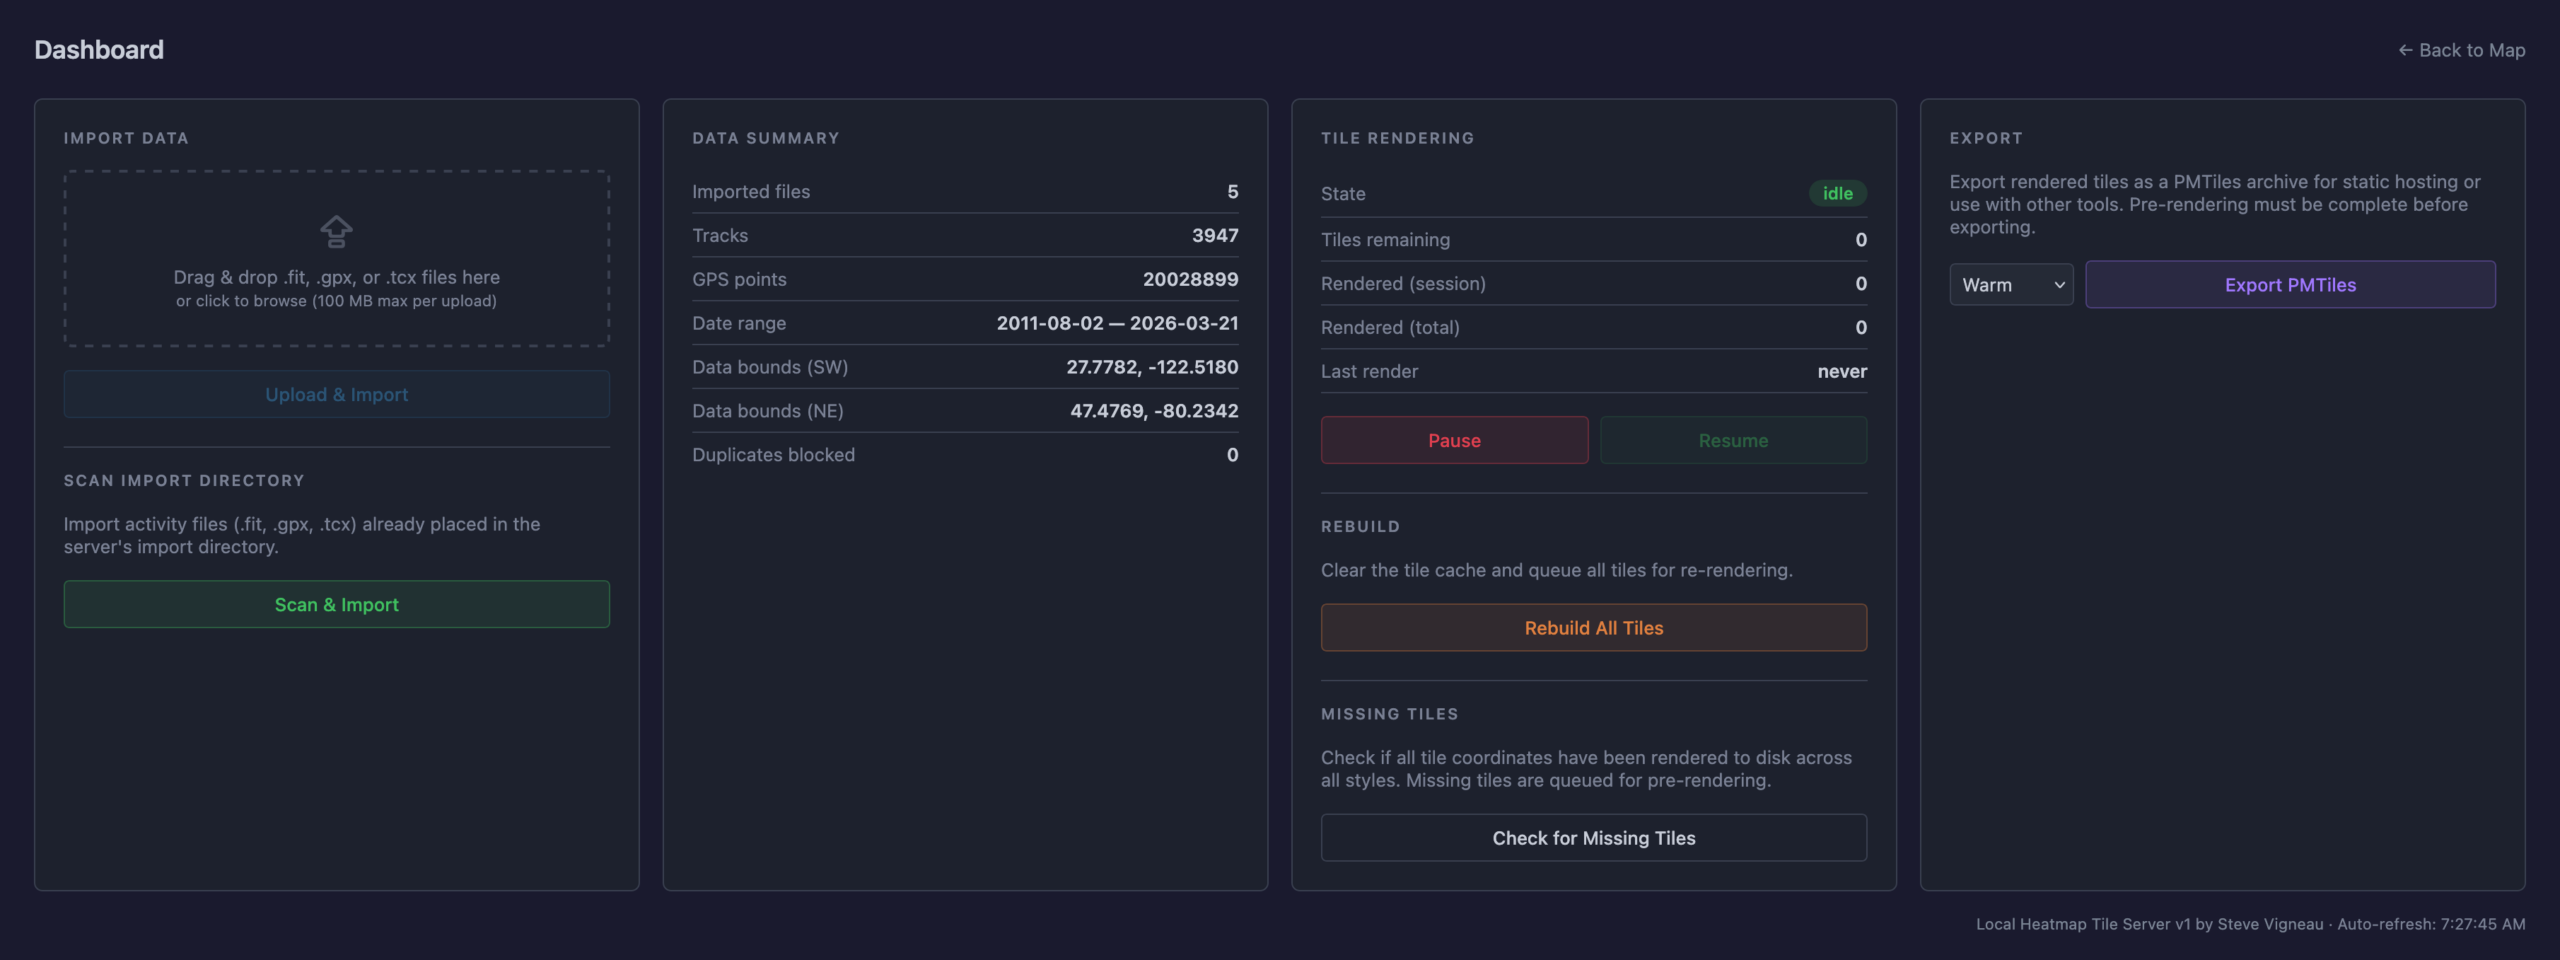
This is a single Docker container that uses a bunch of Python to import GPS data files (.FIT, .GPX, .TCX), imports, deduplicates, and renders a complete set of XYZ tiles. It then makes them available via HTTP (for display in a slippy map or something like JOSM) or exports them to a PMTiles file for simple hosting. And it has a built-in slippy map viewer/data manager and a couple bundled viewers for completely static hosting (example).
Dashboard for importing new files, stats, and exporting the heatmap for static use.
The Python webserver, uvicorn, isn’t the fastest nor great at caching, so the XYZ tiles are fronted with nginx to very quickly serve them from disk, only passing the request back to uvicorn and the Python stack for rendering if the tile isn’t present. Once the tiles are rendered they are cached very quickly served up solely by nginx, to the point where panning and zooming freely is seamless. (And yes, you can pre-render all tiles for optimal performance.)
It’s been tested on ~4000 track single-GPX files (exported from rubiTrack), ~4000 .FIT files directly from Garmin devices, and a bunch of different types of single GPX files. And… it seems to work!
The file inputs (FIT, TCX, GPX) aren’t special and parsers have existed for a long time. Nothing about heatmaps is new. Tile rendering isn’t new. Tile serving isn’t new. Nor are web-based heatmaps from fitness tracker data. But it needed to be glued together to get something that works this way, and this type of development made it possible. And I learned something new about AI-assisted software development along the way. It’s sure an interesting new world with these tools.
And yes, beyond thinking about the features I had to do a lot of nudging along the way.
Some major bugs that were encountered were getting cross-tile heatmap brightness correct, missing cross-tile data, tiles not rendering properly when called via different ways, moving to a faster web server so panning the map felt smooth, and a whole lot of tweaking of brightness and line thickness and blur and such at different zoom levels so it’d feel nice to use, noticing and dealing with malformed XML in GPXs…
But this was nudging via prompts and having a bit of an idea what it was doing, not coding. Which is what’s so weird and new to me. It’s like directing a team of pretty-decent junior devs.
And the end result is something I’ve wanted for a while. And now it exists. (And no, none of this post was written by any AI tool.)
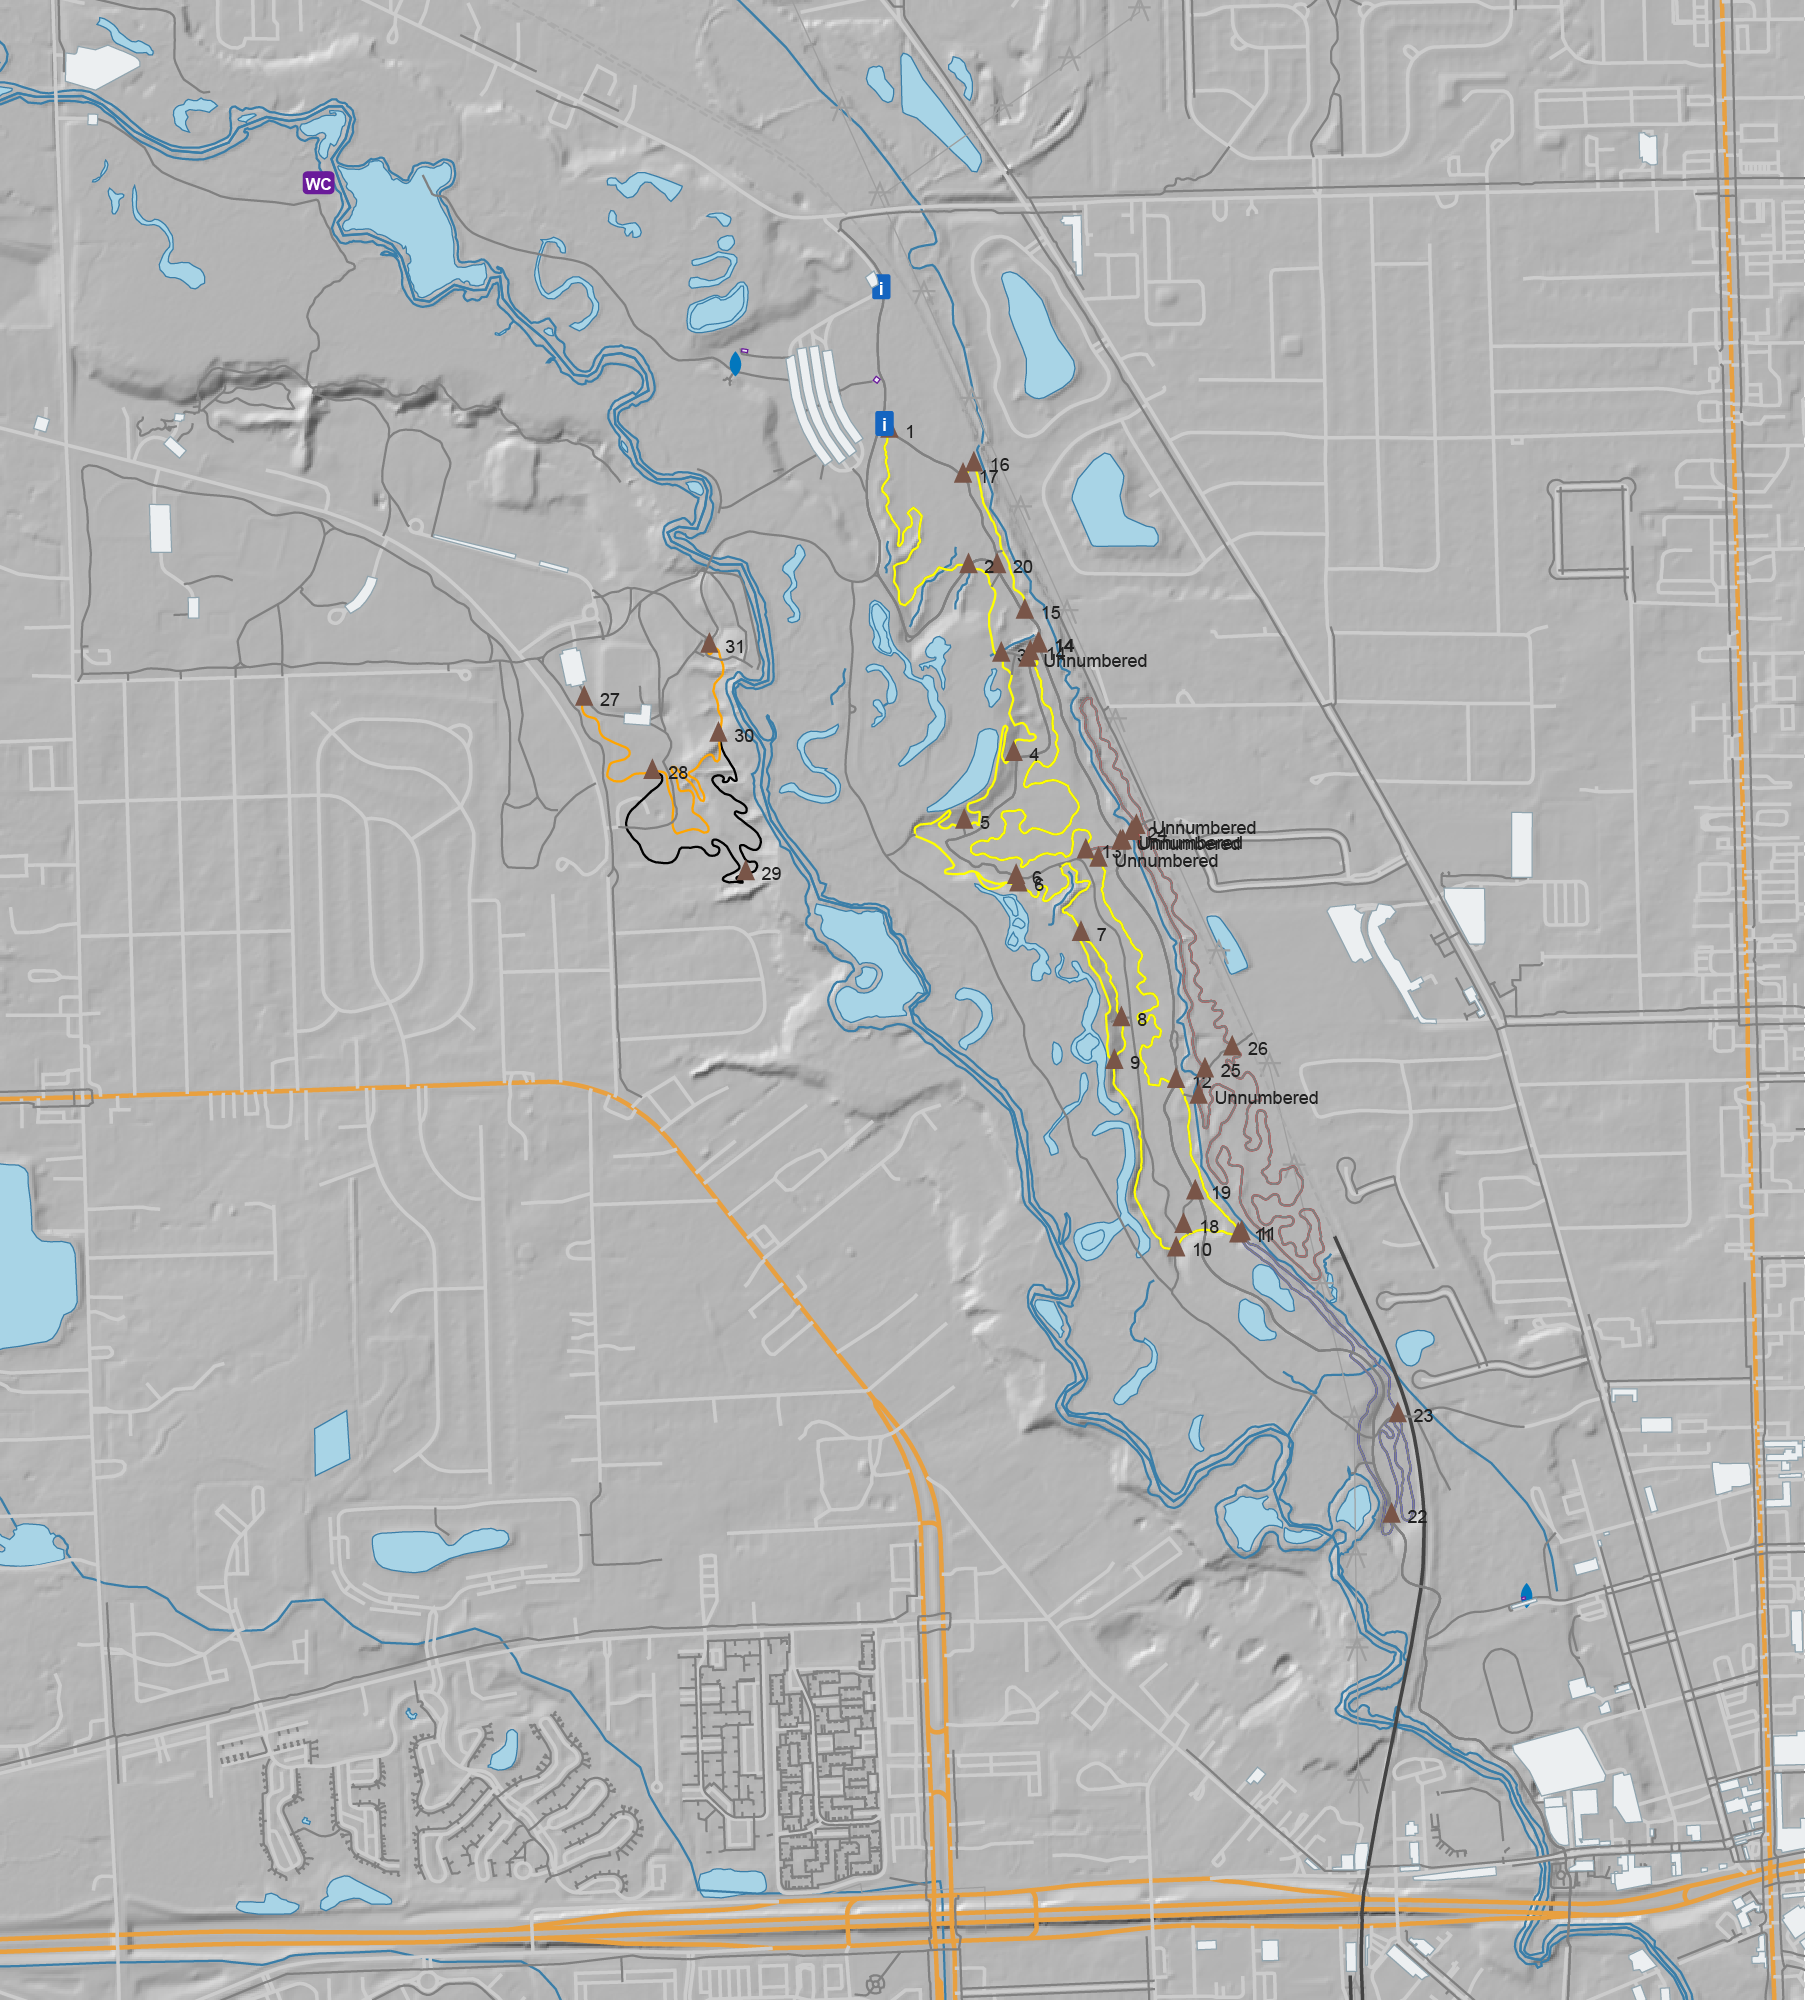
River Bends Park OSM data, with DEM hillshade layer, ready for Adobe Illustrator
After a bunch of years I’ve updated my MTB trail mapping workflow with a much-improved tool for getting OpenStreetMap (OSM) data into Adobe Illustrator. I’ve been experimenting with AI development tools, and I’ve been looking for projects, and this one fit the bill.
My old workflow used osm2ai.pl, a rather crude script (which I found years ago) that’d take an OSM file and turn it into vectors that I’d then group and style in Illustrator. While the tool claimed to filter objects into layers, I never got this working right, so there was a lot of manual work before I could begin styling the map. Each map took a couple of hours solely selecting, joining, grouping, and deleting stuff.
With some time on my hands during a mountain biking trip I began prompting Claude Code, via Visual Studio Code, for something similar: a tool which would take OSM data and make it usable in Illustrator. After a bit of back and forth I ended up with this: c0nsumer/osm_to_ai.
I very intentionally had Claude write everything on this, from the script to the readme, and it seems to have been a success. A bit of experience was gained, and I now have a tool that’ll read in OSM data (either exported from tools or queried live) and produce an Illustrator-compatible SVG that has trails grouped by OSM tag, colored, etc. All ready to finish up in Illustrator. It even has an extra layer of USGS 3DEP hillshade data, something I’ve wanted for years after seeing it on the Noquemanon Trails Network maps (but didn’t know how to do in Illustrator).
This was both a good exercise in using AI tools to assist in simple software development and helped streamline my mapping process. While I have a general discomfort with AI-developed code ending up with potentially uncertain output, this output is immediately validated visually, so it’s fine.
Unplanned, but on quick check this seems to have the side-effect of being compatible with Affinity Designer. While this wasn’t (yet) an intention, I’ve been looking for a good way to move away from Illustrator due to software cost (this is volunteer stuff, after all) but the old osm2ai.pl needed replacing before I could do that. This will make that possible.
So what next? Maybe I’ll see if I can make the PDF maps geospatial. This has long been a goal of mine, as it’d allow my maps to be opened in something like Avenza Maps and they’d show one’s actual location on the trail. But for now, I’ll start here.
As an overview, here’s the --help output to show what it can do:
(venv) PS C:\Users\svigneau\Desktop\OSMtoAI> python .\osm_to_ai.py --help
usage: osm_to_ai.py [-h] (--file PATH | --bbox BBOX | --overpass FILE) --output PATH [--width PX] [--dem PATH] [--fetch-dem] [--dem-resolution METERS] [--sun-azimuth DEGREES]
                    [--sun-altitude DEGREES] [--save-osm PATH]

Convert OSM data to an Adobe Illustrator-compatible layered SVG.

options:
  -h, --help            show this help message and exit
  --file PATH           .osm file to read
  --bbox BBOX           Bounding box: min_lon,min_lat,max_lon,max_lat
  --overpass FILE       File containing an Overpass QL query
  --output PATH         Output .svg file
  --width PX            SVG width in pixels (height is auto-calculated, default: 800)
  --dem PATH            GeoTIFF DEM file to generate a hillshade layer (any CRS)
  --fetch-dem           Download a USGS 3DEP DEM automatically and use it for hillshade. Saves a sidecar .tif next to --output for reuse.
  --dem-resolution METERS
                        Target DEM pixel size in metres for --fetch-dem (default: 3). Use 1 for lidar-quality where available, 3 for 1/9 arc-second, 10 for 1/3 arc-second.
  --sun-azimuth DEGREES
                        Sun azimuth in degrees clockwise from north (default: 315 = NW)
  --sun-altitude DEGREES
                        Sun altitude above horizon in degrees (default: 45)
  --save-osm PATH       Save the downloaded OSM XML to a file for later reuse with --file

Examples:
  python osm_to_ai.py --file mypark.osm --output mypark.svg
  python osm_to_ai.py --bbox "-71.12,42.36,-71.10,42.38" --output mypark.svg
  python osm_to_ai.py --overpass query.overpassql --output mypark.svg
  python osm_to_ai.py --file mypark.osm --dem elevation.tif --output mypark.svg
  python osm_to_ai.py --file mypark.osm --fetch-dem --output mypark.svg
  python osm_to_ai.py --file mypark.osm --fetch-dem --sun-azimuth 270 --sun-altitude 35 --output mypark.svg

(venv) PS C:\Users\svigneau\Desktop\OSMtoAI>
Pick one of the files from the ZIP and let it load.
After it loads, go to Strava’s Global Heatmap, logging in if you need to. Then click the nine-box grid icon (same as the extension’s icon) that appears in the upper-right of the map.
Click Open in JOSM and the global heatmap will appear in JOSM.
To customize things a bit more — which helps quite a bit with visibility in JOSM — one can edit the map by picking a different activity and changing the gColor query in the address bar before opening in JOSM.
gColor options include hot, blue, purple, gray, andbluered. The activity can be changed via sport= and include the main Walk and Ride, and the lesser-used MoutainBikeRide, GravelRide, Snowshoe, etc.
But note that the extension doesn’t support all of these, so you may need to play with the URI in the new tab that opens to get things to display quite as you want. (I guess that’d be easy enough to change…)
Kristen and I have been spending a good deal of time in the Ishpeming and Negaunee area this year, and I’ve made it a personal goal to become more familiar the local trails — both RAMBA-supported and otherwise — and get them documented OpenStreetMap (OSM). Having these trails in OSM provides two big benefits: they appear in other mapping tools (such as OsmAnd, GaiaGPS, Strava, MapMyRide/MapMyRun) and the trail data can be freely used to build other tools.
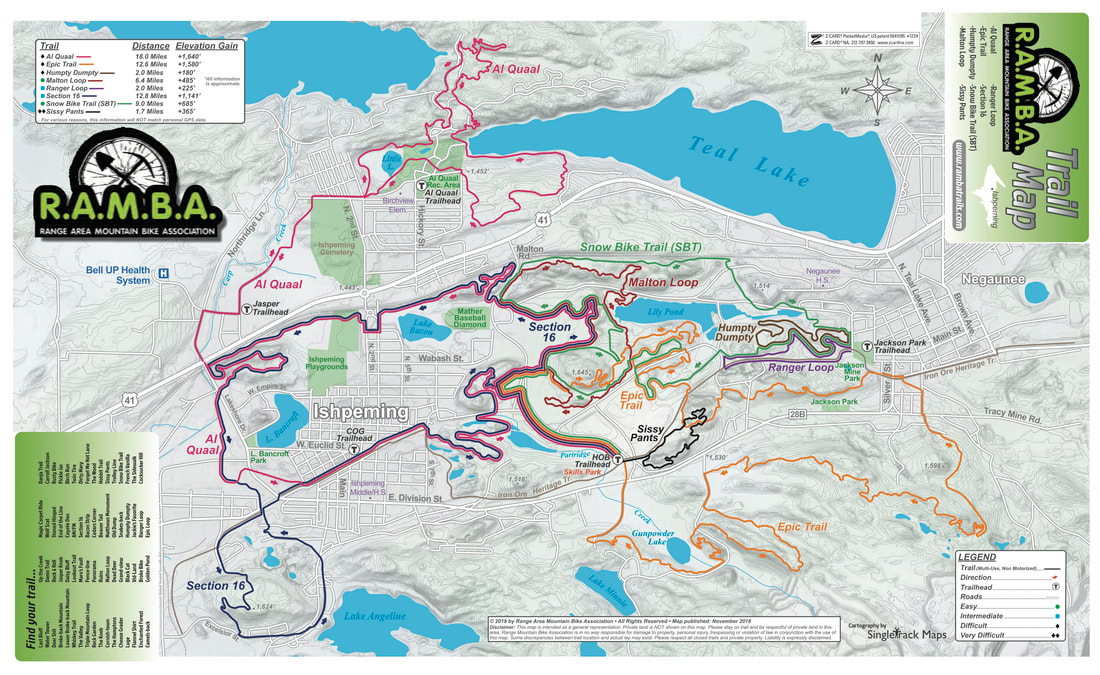
Official RAMBA Map v6 from 2018
Over the years of making trail maps with OpenStreetMap I’ve mostly produced PDFs for printing, leaving mobile and online mapping to other apps. These work well, but have the big downside of rendering routes with their style. That is, online maps via these tools’ show the routes, but look quite different from print maps, even if all the data for them to display more data (such as colour=* tags on relations) is in OSM.
While these apps work pretty well, and I use them myself routinely for navigation, I got the itch to see if I could make a web-based map that looked more like locally produced print maps than app-based renderings. It seemed like a good project, a good way to learn some basics of modern web development, and maybe make something useful.
What I ended up with was a slippy map of showing the RAMBA trails that uses layers of pre-rendered tiles to show the different official trail routes, placed over a background map. The map viewer is client-side JavaScript that loads static tiles from a basic web server, making this a very simple app to host (just a bunch of static files on a site).
In this post I intend to document the major steps of how I made this map, why I used the tools I did, and share the code to reproduce (and update) this build. Hopefully this’ll allow others to get their head around these map presentation basics, perhaps even reusing this work to make and host another map.
Update OSM Data
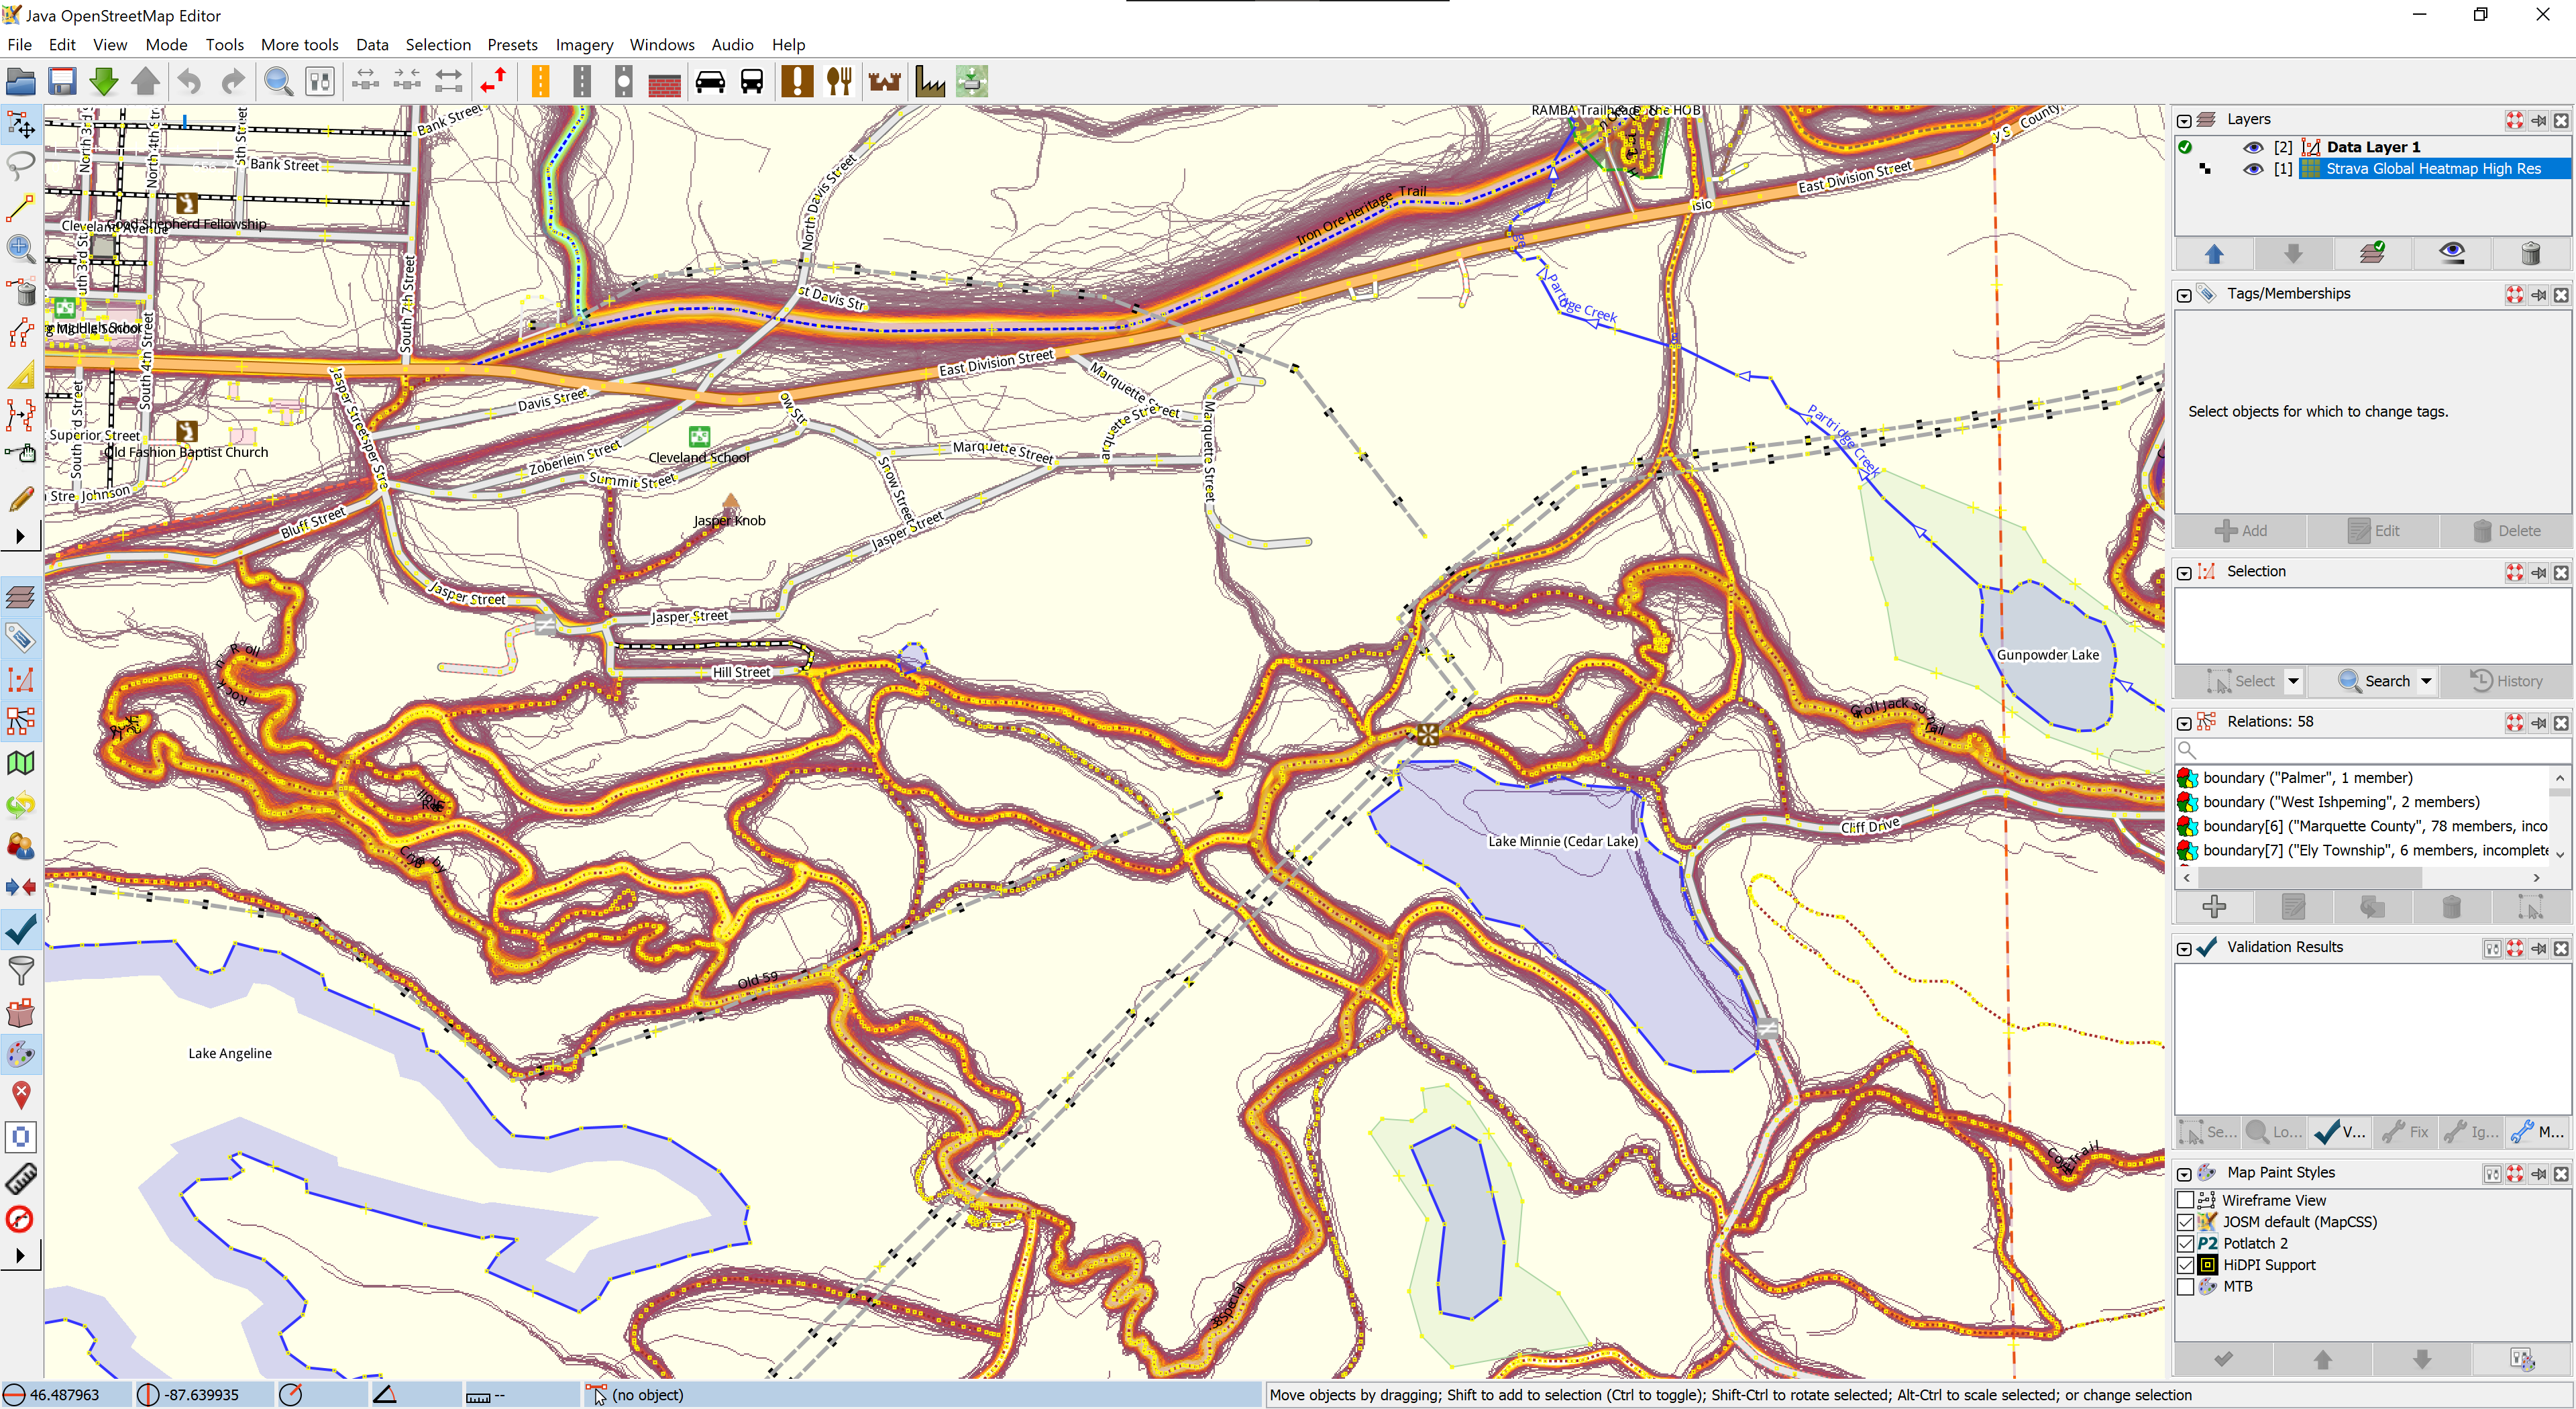
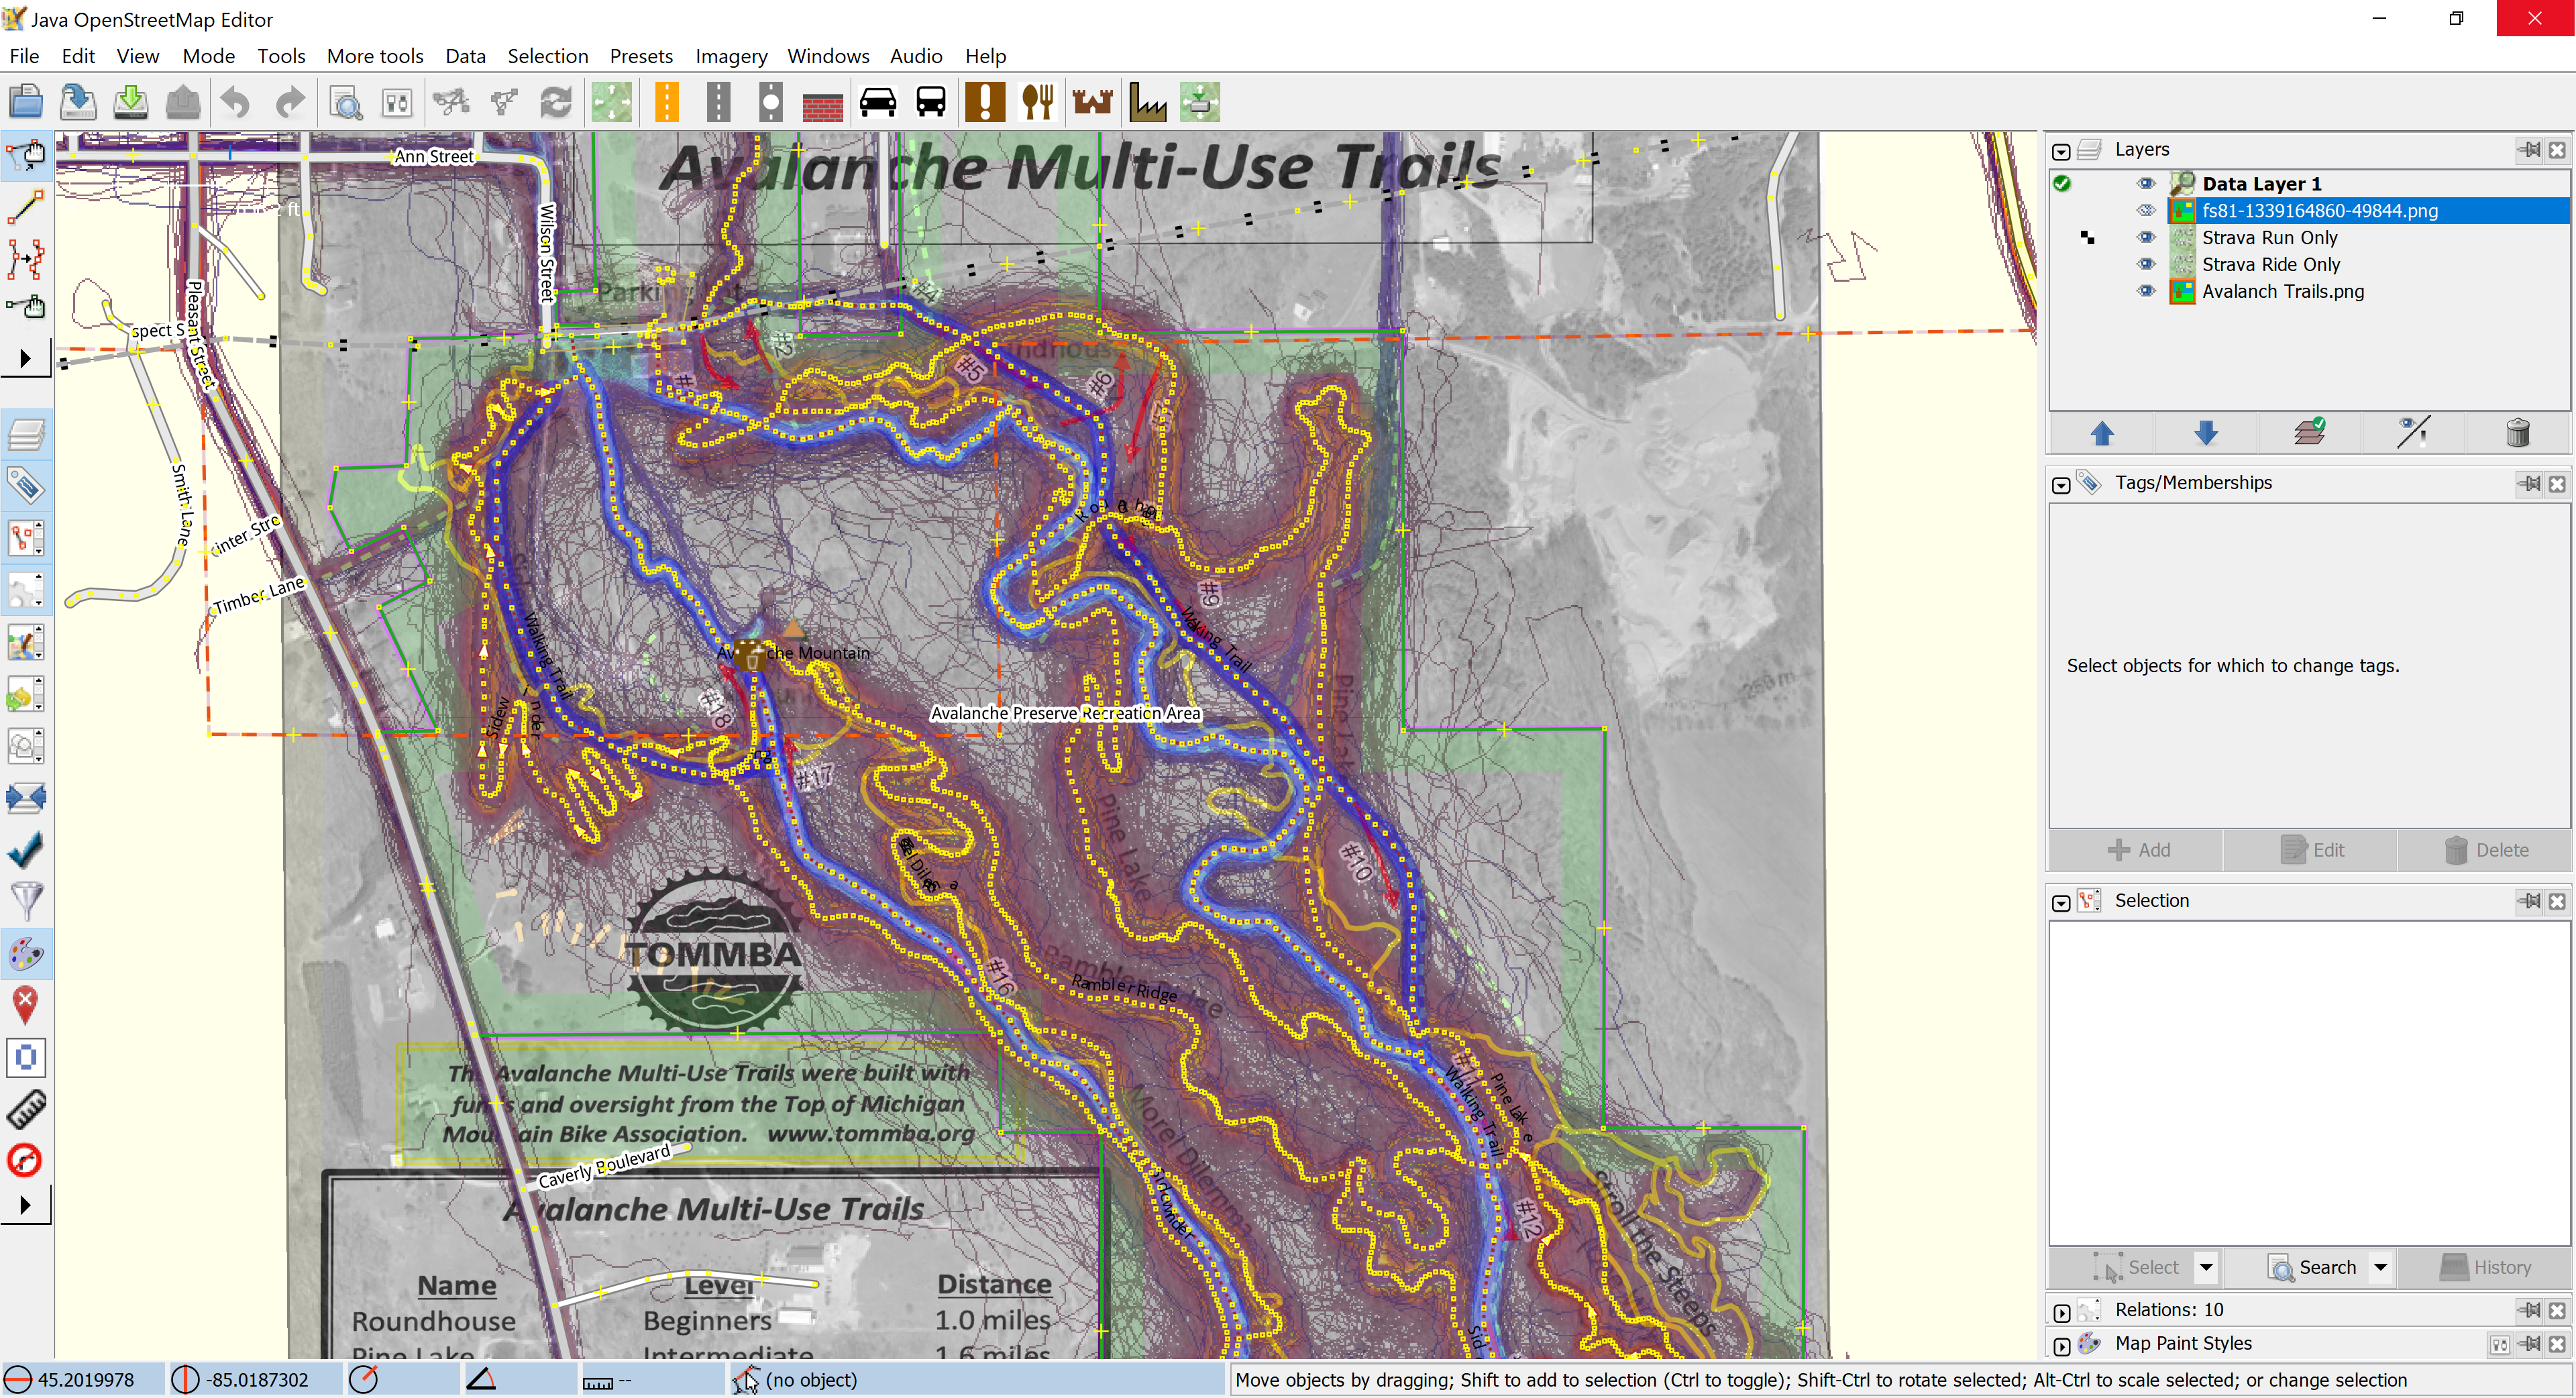
Strava Global Heatmap in JOSM
Mostly outside the scope of this article but worth a mention, a significant amount of time was spent ensuring that the RAMBA area trails are accurately listed in OSM. Without good data it would not be possible to go further, as the OSM data is the base data used to create other maps.
By combining information from a bunch of sources, and doing some personal surveying of trails while riding and hiking, I was able to get all of the official RAMBA trails documented, along with numerous other paths and tracks in the area. This building a complete picture of the usable trails in the area.
Information used to get the RAMBA trails in OSM included:
Hand-annotated map from Danny Hill listing local trail names.
These sources were combined in JOSM, cross-referenced, ways drawn and tagged, relations built out, and before long a complete picture of the RAMBA-area trails — official and otherwise — were in OpenStreetMap.
Most importantly, beyond documenting the trail locations, trails were grouped into route relations to show each official route, and then all the official routes were grouped into a superroute for all the RAMBA trails. As of time of writing, relation RAMBA Trails (12425503) is the superroute that aggregates the individual trail routes such as Epic Loop (8467869) and Malton Loop (8468010).
The result of this is accurate trail data that’s easy to query for and style using other tools.
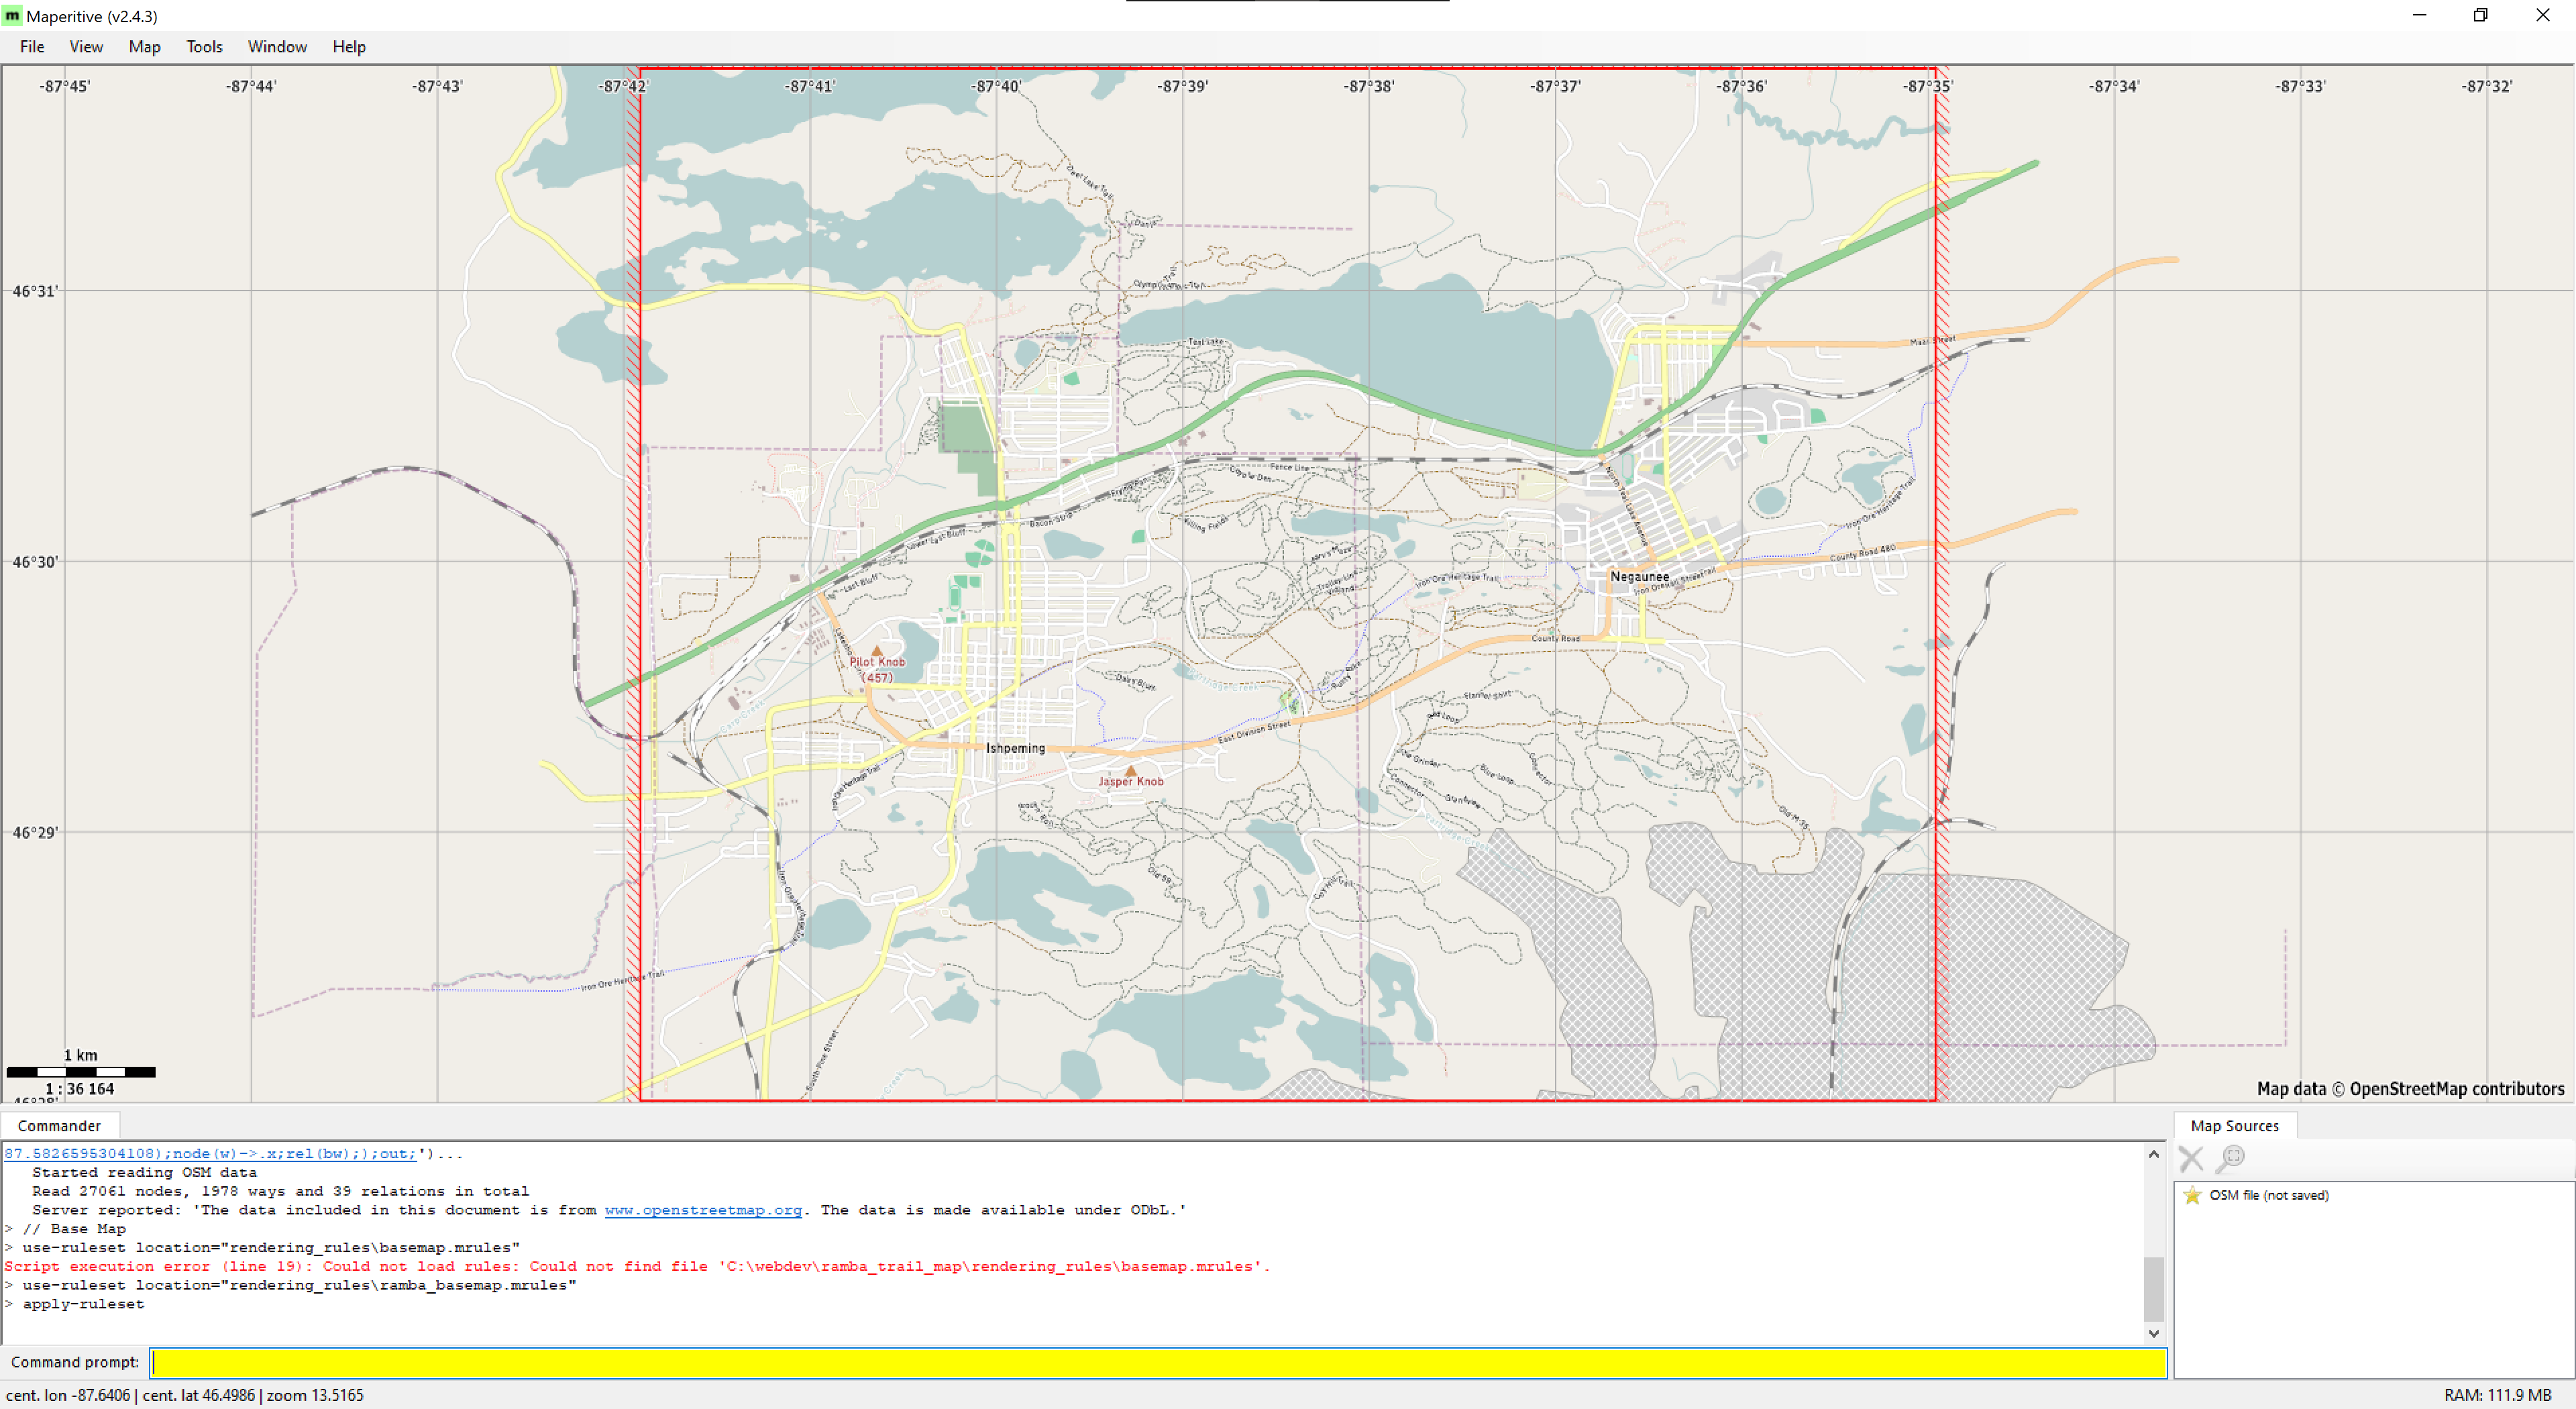
Rendering Tiles with Maperitive
There are myriad ways to render tiles from OSM data, with most of these involving setting up a database server and a toolchain which’ll generate, cache, and serve tiles on demand. For most large data sets this makes a lot of sense, but for a small trail system I really wanted to use static tiles I could serve from a simple webserver.
Eventually I came across Maperitive, a desktop application for Windows that takes GIS data (including OSM), stylizes it with a relatively simple ruleset, and can generate tiles in the standard XYZ format for use elsewhere. It can also be scripted, which meant I could use it as part of an automated workflow to generate new tiles as the OSM data changes. This seemed like a good solution, so I set about writing some rulesets that would reasonably show the RAMBA trail routes and some automation around it all.
After a lot of experimenting I settled on a having separate tile set for each of the official loops, an overview of all trails, and a base map. The base map would always be shown, and a user can toggle between layers which highlight all the trails or individual loops.
After a few iterations of custom rules, I settled on a simplified set based on the Default.mrules file which comes with Maperitive for rendering the base map. The only modification was changing the font to Michael Adams’ Roadgeek 2005 Transport Medium font, as it looks nicer than the default, Verdana. For the overview and route layers I created simple rules based on the the default rendering of highway=path, using the Heavy version of the font. The rule for each trail route (relation) selects the trails in a given relation then colors them accordingly.
Creating these rules took a bit of fiddling, as Maperitive is both a bit of a dead project, not completely documented, and (in the latest Beta) sort-of buggy where sometimes the map display would stop updating. Still, even though I’m not great at making attractive things, I was able to come up with something that worked well enough.
Conveniently, Maperitive also comes with a command line version (Maperitive.Console.exe). After settling on rendering rules and a tile generation script, I used this as part of an automated workflow which downloaded OSM data directly then rendered each of the tile sets.
After tile generation I used a Windows binary of OptiPNG to losslessly compress the tiles, resulting in a ~62% space savings (original: 746MB, optimized: 286MB) which’ll reduce storage and bandwidth overhead.
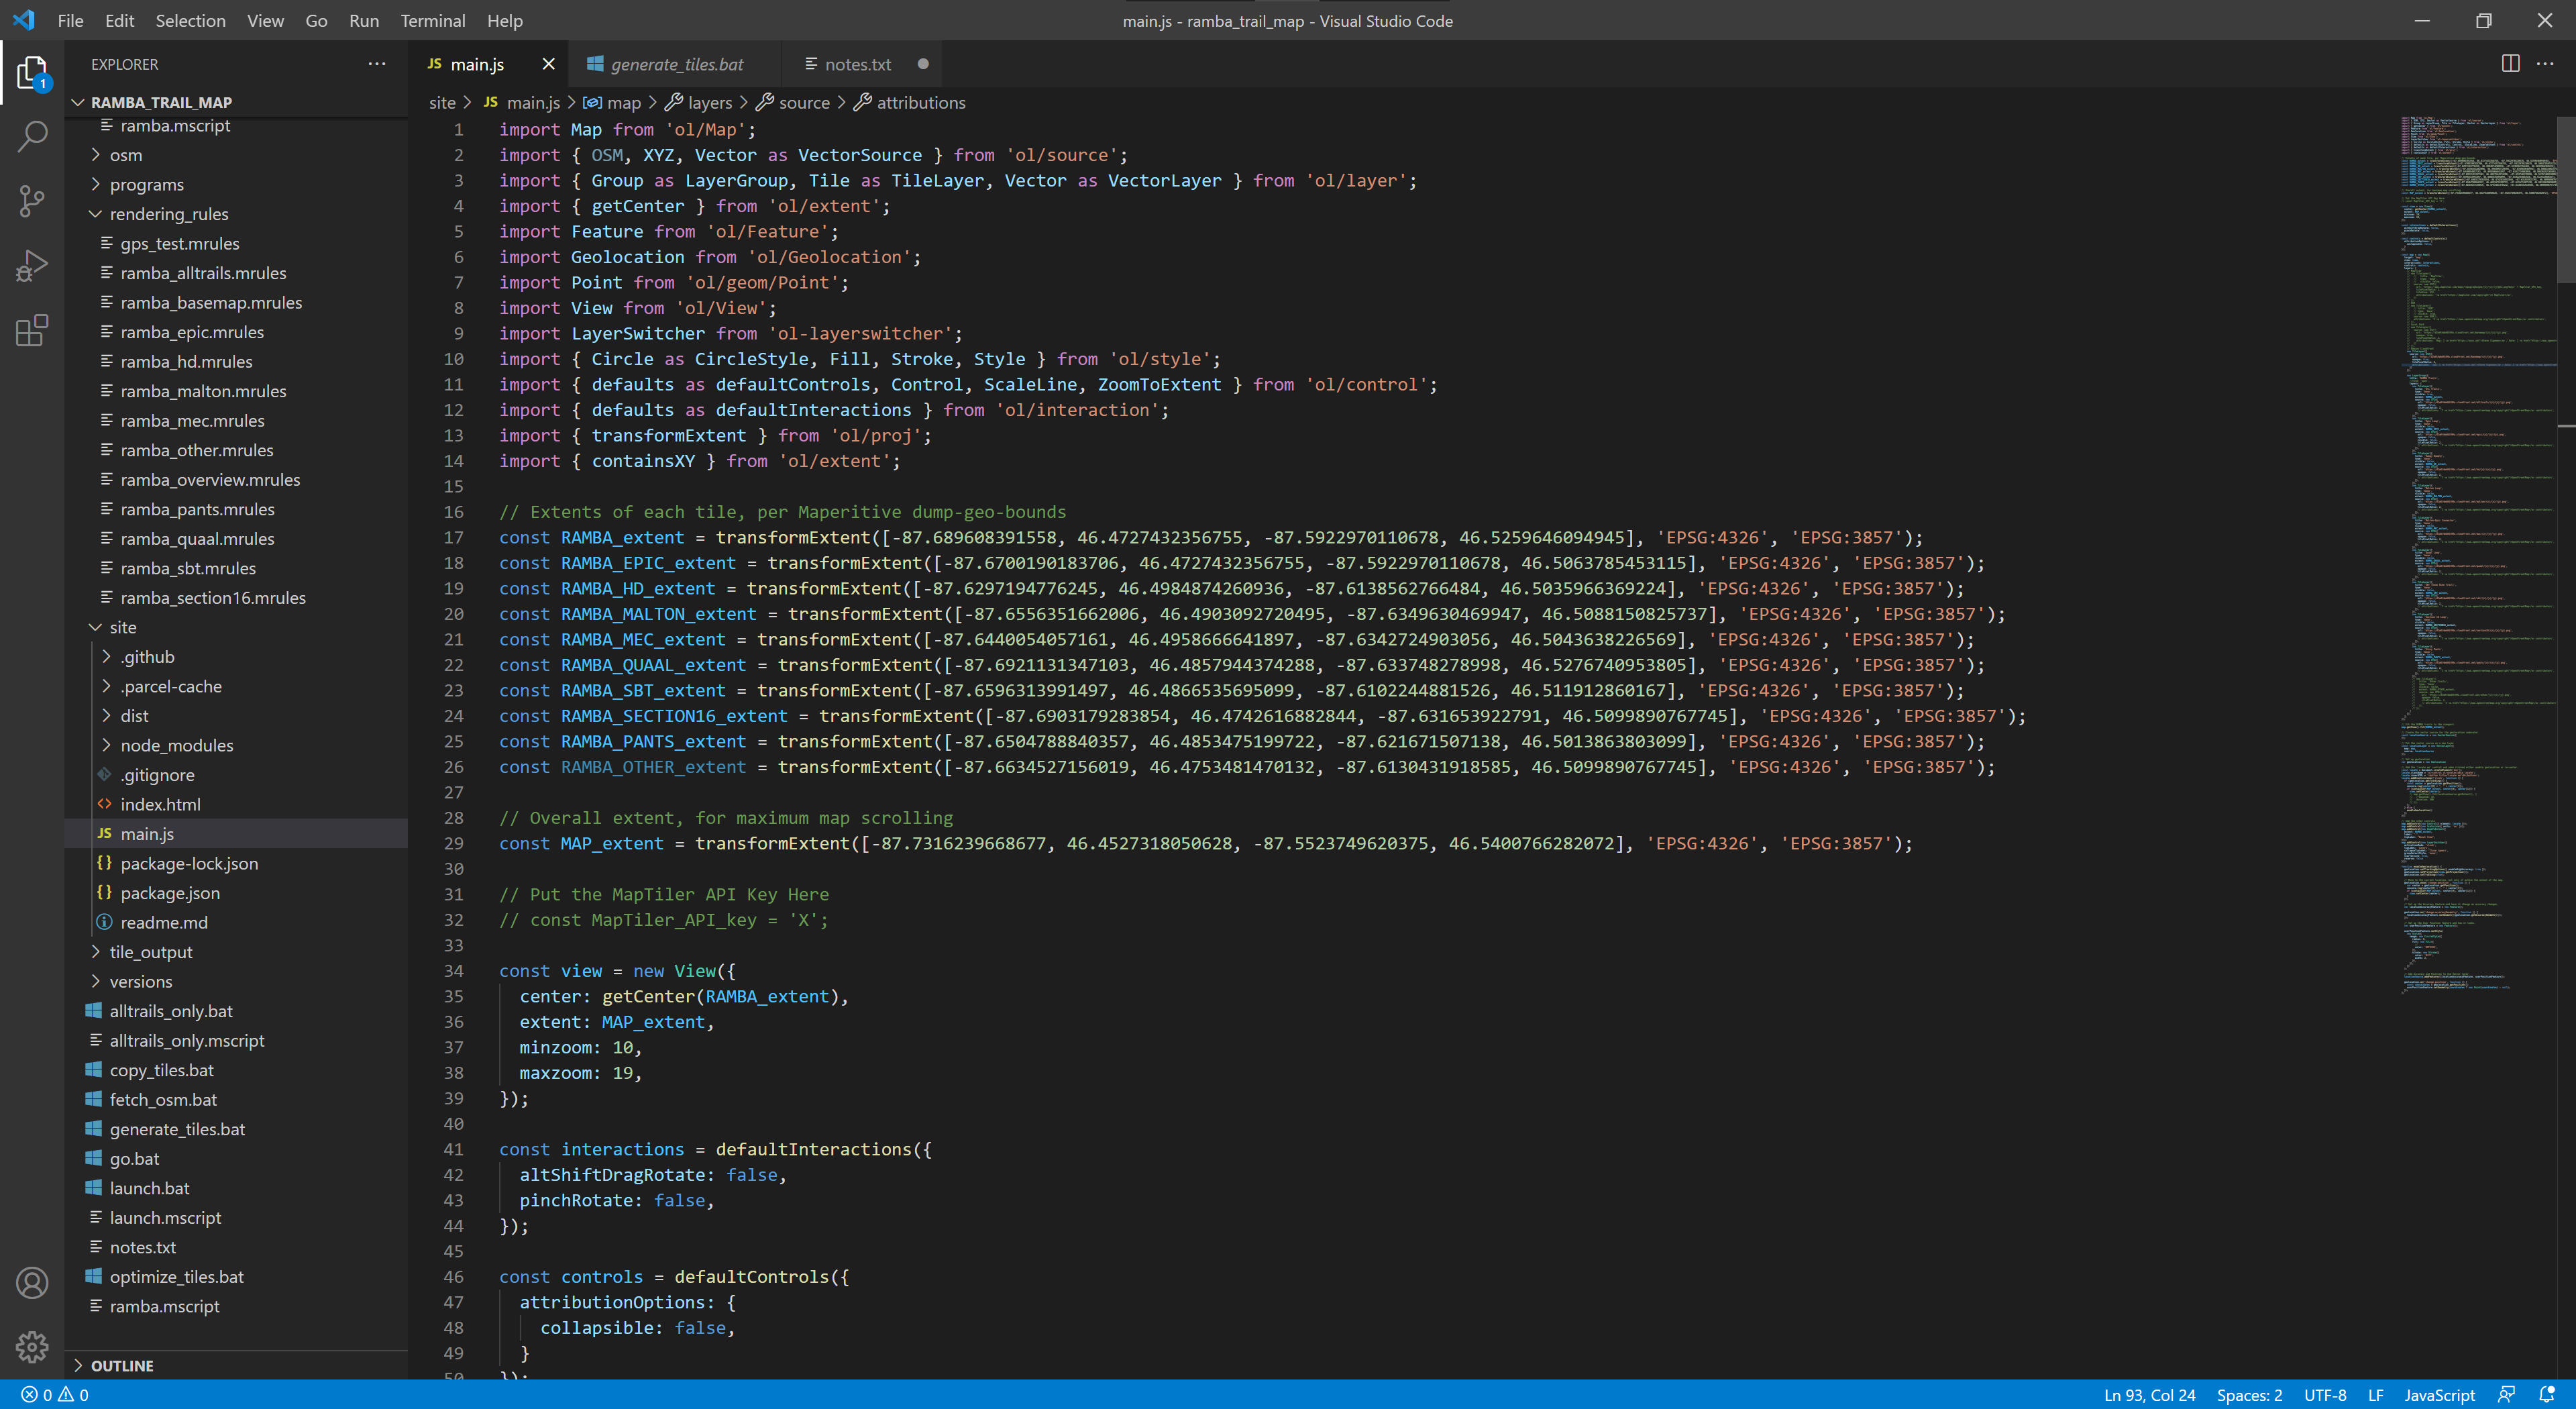
The Front End
Editing in VS Code
With tiles generated I needed a way to display them. It turns out that OpenLayers was easy to use and it all ran as simple client side application in a browser. By using npm and parcel, with Visual Studio Code for editing, it was quite easy to get the site developed, tested, and bundled up for deployment. The only component I had to add was ol-layerswitcher control, which provides an easy way to toggle between layers.
Prior to this I had very little experience with modern web development, with my exposure to JavaScript pretty much limited to reading others’ code to figure out what it’s doing. After a bit of confusion (and having to accept the hidden complexity of using an application bundler), I was able to focus solely on writing a single main.js file with a basic index.html that together do what I wanted:
Run full screen by default.
Show all trails by default, with toggles for the defined routes (layers of the map).
Show an attractive background map below the routes to show the rest of the area.
Offer controls to use geolocation to showing one’s location on the map and reset the view to the original map extents.
Look sane on desktop and mobile devices.
This ended up being much easier than I thought, and between the OpenLayers Examples and just some basic programming I was able to get something I’m happy with. Far more time was spent designing the tiles and thinking about what I wanted it to do than writing the code to display it all.
Tile Hosting
The actual map tiles are a number of small PNG files, and a typical session of viewing and panning around the map can result in hundreds of image loads. This was seeming a bit slow when being served from nuxx.net via HTTP/1.1, so I looked into using HTTP/2 to improve performance.
Unfortunately, it was not simple to turn on HTTP/2 here at nuxx.net as I’m using PHP for WordPress, which in turn requires MPM prefork, which precludes mod_http2. I could have set up another web server and such, but for now I’m hosting the tiles in AWS, with the tiles uploaded to an S3 bucket and served via CloudFront.
This should allow for better tile download performance than what I can do from my server. Despite potentially incurring a bit of a financial cost it is a good experiment in hosting tiles in the cloud. I may change this in the future, particularly if it becomes cost prohibitive, but for now it’s working well.
Follow Along At Home
If you would like to generate this same map, start by downloading this ZIP file: ramba_trails_map_code_1.0.zip. It contains the scripts and rules needed to generate the map tiles (ramba.mscript and the .mrules files), the index.html, main.js, and package.json for the OpenLayers-based front end, the .osm file used to generate the first release of the map, and a few batch files that tie it all together.
These batch files are included to will help you out, but may need some editing to fit on your environment:
fetch_osm.bat: Uses curl to download all OSM data within a bounding box that encompasses the Ishpeming/Negaunee area.
generate_tiles.bat: Runs ramba.mscript via Maperitive.Console.exe to generate the tiles.
optimize_tiles.bat: Copies the unoptimized tiles from the .../tile_output/raw output directory to the .../tile_output/optimized directory, then runs OptiPNG against the tiles to optimize them in place.
To build the web app you’ll need to install npm, parcel, create a new OpenLayers app as per the directions here. Then install ol-layerswitcher (npm install ol-layerswitcher), replace the default index.html, main.js, and package.json with the ones I provided, and you should be ready to go.
Updating the Map
As you can see, the map is two major pieces: the front end and the tiles. Whenever the map data changes in OSM the tiles can be regenerated to update those layers. The code for the front end web app only needs to change if the storage location changes, features are going to be added, etc.
Conclusion
This map has worked out rather well and I’m happy calling it v1.0. It’s been a great learning experience, and I’ve even managed to produce something useful that didn’t exist before: an interactive map of some of the most rugged single track trails in Michigan; one of my favorite places to ride mountain bikes.
It’s far from perfect, and there are some things I could do differently, but for now, I’m considering it a success. When in Negaunee for vacation last week I successfully used development versions of this map to find my way around, so I know it’s better than nothing.
If you find any quirks in the map data — such as trails with wrong names or in the wrong location — please take a screenshot and show me what’s wrong and email that to steve@nuxx.net. I’ve done my best to ensure the RAMBA trails are accurately mapped, but I’ve certainly missed some things.
Problems
No key or other ancillary information (such as logos) as are normally found on print maps.
No terrain. While 1m DEM elevation data is available from the USGS, I couldn’t figure out how to use it in Maperitive for generating hillshading.
No easy way to add clickable items to show additional info, link to external map apps (eg: for navigation).
Maperitive’s text rendering isn’t the best, resulting in goofy looking text at some zoom levels.
Long trails only have one label placed on the middle. Trails with one name broken into multiple ways will be labeled numerous times.
Due to being run in a browser it’s a sufficient, but not great, mobile experience. Specifically, selecting the geolocation, recenter, and layer controls can be fiddly because they are so small.
Does not work offline, but thankfully most of the RAMBA area now has good mobile data coverage.
Things To Investigate
Keep an eye on AWS cost and performance.
Look at Leaflet for the front end, as it seems a bit more modern.
Consider rendering map tiles with TileMill. This will add a lot of complexity both in setup and styling tiles, but once done should allow a lot more flexibility in styling and overcome most of Maperitive’s problems. mapbox/mbutil should work for getting XYZ PNGs out of MBTiles files.
Consider using a tile server if I don’t want to deal with discrete files.
Look more into using vector tiles with client-side styling. (I passed on this for now, as a GeoJSON file showing each of the route is a large download and had no benefit over raster tiles.)
Maperitive should run under Mono, and OptiPNG is available for many platforms, meaning it should be possible to reproduce this build under macOS or Linux. Note that the GUI for Maperitive will not currently run on macOS due to Windows.Forms currently being based on Carbon, which is not available for 64-bit macOS. So while the CLI should work, the GUI version isn’t currently compatible with macOS 11.5 (Big Sur) and higher.
Consider the following: You are attempting to update OpenStreetMap (OSM) trail routes using JOSM and find that the previous way is very detailed, but fairly wrong, meaning that a lot of nodes will need to be moved.
Even with the Improve Way Accuracy tool this’ll be a pain. So what can you do? First decrease the number of nodes using Simplify Way and then move the remaining nodes, adding new ones as needed in the gaps. This will keep the original way intact, keep most of the route present, but allow for easy cleanup. It also reduces the number of nodes, making for simpler routes that take up less space on GPS devices. (I find that a maximum error setting of 0.5m or 1m works well.)
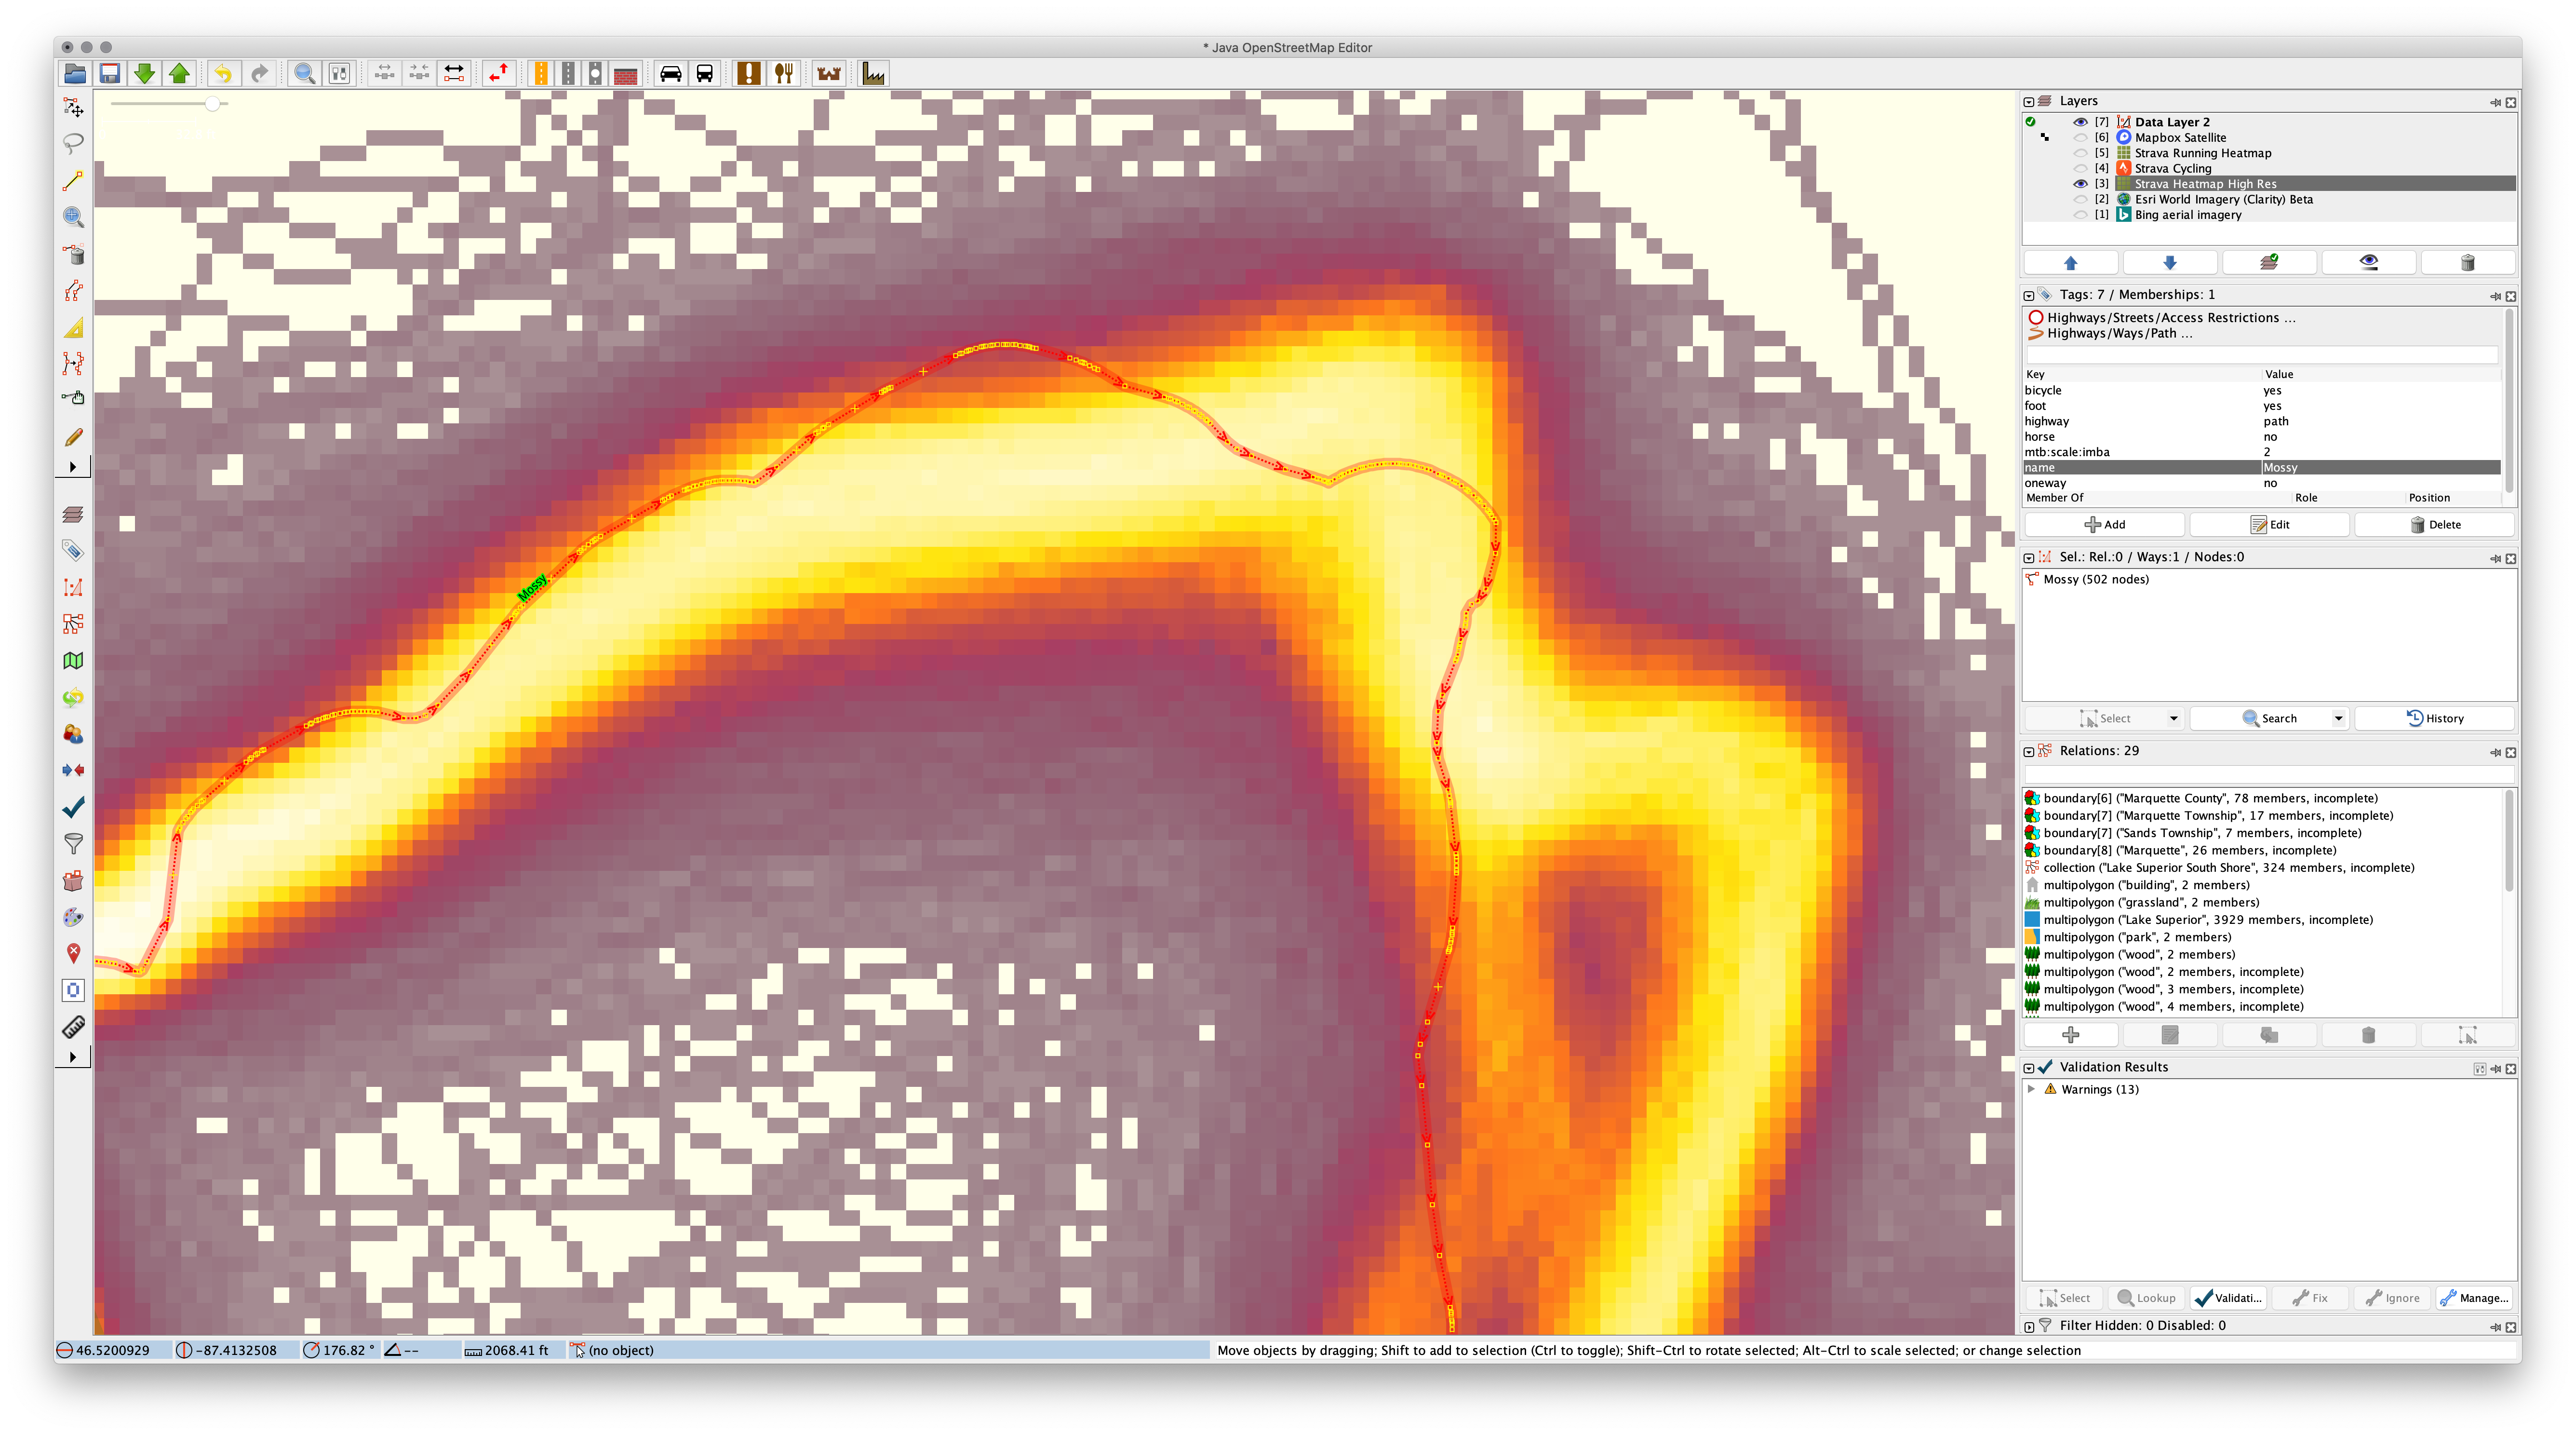
In 2016 I used the official GIS data from the Noquemanon Trails Network (NTN) to add the singletrack trails to OSM. This worked pretty well, but since then it’s become possible to trace the Strava Global Heatmap high-resolution data when mapping. When doing some routine updates and using this layer for assistance I noticed how many trails originally entered using the NTN’s official data aren’t quite correct. So along with adding changes, I’m tweaking the trail routes using the Strava data.
The primary issue is that the official data would often have a large number of points very close together — in some cases just inches apart — particularly around curves. These points were much closer than needed for accurate mapping, and yet these curves would be the main things that needed adjusting. Moving all of these points would be a hassle and the resolution wasn’t necessary, so by simplifying the route, correcting the nodes that remain, and adding in more as needed, cleanup of the route is much faster. It also reduces the number of nodes along each way, saving space.
The following images show a great example of this problem along Mossy (way 40781586), the last piece of single track in Pioneer Loop (relation 6109593) when ridden clockwise from the trailhead:
Detail of original data for Mossy in JOSM. Note the very detailed, yet inaccurate, curves.Mossy after simplifying the way with 1m maximum error.After manual cleanup of the simplified Mossy using the Improve Way Accuracy tool
Get osm2ai.pl working on your computer. I run this on macOS, and it works fine on Linux as well. Since it’s a Perl script there are probably some dependencies; likely resolved by installing a few modules.
Process each OSM file with: osm2ai.pl --input infilename.osm --projection mercator --output outfilename.ai
Open each file in Illustrator, combine them into a larger document, make it look the way you want, etc.
Mapping trails in OpenStreetMap (OSM), using JOSM, is done by overlaying one or more data sources, then hand-drawing the trail locations using this background data as a guide. While not a default in JOSM, with a little know-how and a paid Strava Subscription the Strava Global Heatmap data for this can be used as well.
While there’s a fair bit of info about doing this scattered across some JOSM tickets (eg: #16100), this post is to document how I make this work for me by creating a custom Imagery provider. Because there isn’t an official (and robust) plugin to authenticate JOSM against Strava it’s a little tricky, but overall isn’t bad.
First, you need to sign into Strava, then go to the Global Heatmap and get the values of the three cookies CloudFront-Key-Pair-ID, CloudFront-Policy, and CloudFront-Signature. These values are essentially saved credentials, and by using them in a custom Imagery providerURL, JOSM will use these to access the Global Heatmap data via your account and make it available as an Imagery layer.
The easiest way to get these cookie values is to use the Developer Tools built into your web browser:
Launch your web browser, either Firefox, Chrome, or Edge.
Go to the Strava Global Heatmap, sign in if needed (check the Remember me checkbox), and be sure it’s properly displaying high resolution data.
Load the developer tools for your browser to show cookie details:
Firefox: Click the Hamburger Menu → Web Developer → Storage Inspector (or press Shift-F9), expand Cookies and click https://www.strava.com.
Chrome: Click the Three Dots Menu → More tools → Developer tools (or press Ctrl-Shift-I), select the Application tab, expand Cookies, then click https://www.strava.com.
Edge: Click the Three Dots Menu → More tools → Developer Tools (or press F12), select the Storage tab, expand Cookies, then click heatmap.
Get the value of three cookies, CloudFront-Key-Pair-ID, CloudFront-Policy, and CloudFront-Signature, and make note of them (in Notepad or such). You’ll need them to build the custom URL. Here’s examples of what the three cookies will look like:
Paste the string from Step 2 into Box 4, Edit generated TMS URL (optional), and then give it a name in Box 5, such as Strava Global Heatmap High-Res.
Click OK twice to return to the main JOSM window, and then try to use this layer over some existing data, just as you would aerial imagery.
If it doesn’t work, double-check your URL and be sure the entered cookie values are right, including the underscores after CloudFront-Policy and CloudFront-Signature. Also be sure you haven’t logged out of Strava, as this will expire the cookies. (If you make changes to the URL in JOSM you will need to delete the existing imagery layer and then re-add it to have the new URL used.)
These cookie values, in particular CloudFront-Signature, will occasionally change as cookies are expired and reset or if you log out of Strava. If things were working and then stopped, you may need to get new cookie values from your browser and update the TMS strings.
By default the TMS URL we started with shows the default heatmap, for all activity types, with Hot coloring. Depending on what other data you are working with it may be useful to show just Ride or Run data, perhaps in different colors. In the TMS URL, the first part after tiles-auth is the type of data, and the second is the color. By using this format, replacing [data] and [color], you can create additional heatmap layers:
Valid values for type of data: all, ride, run, water, winter.
Valid values for heatmap color: hot,blue, purple, gray, bluered.
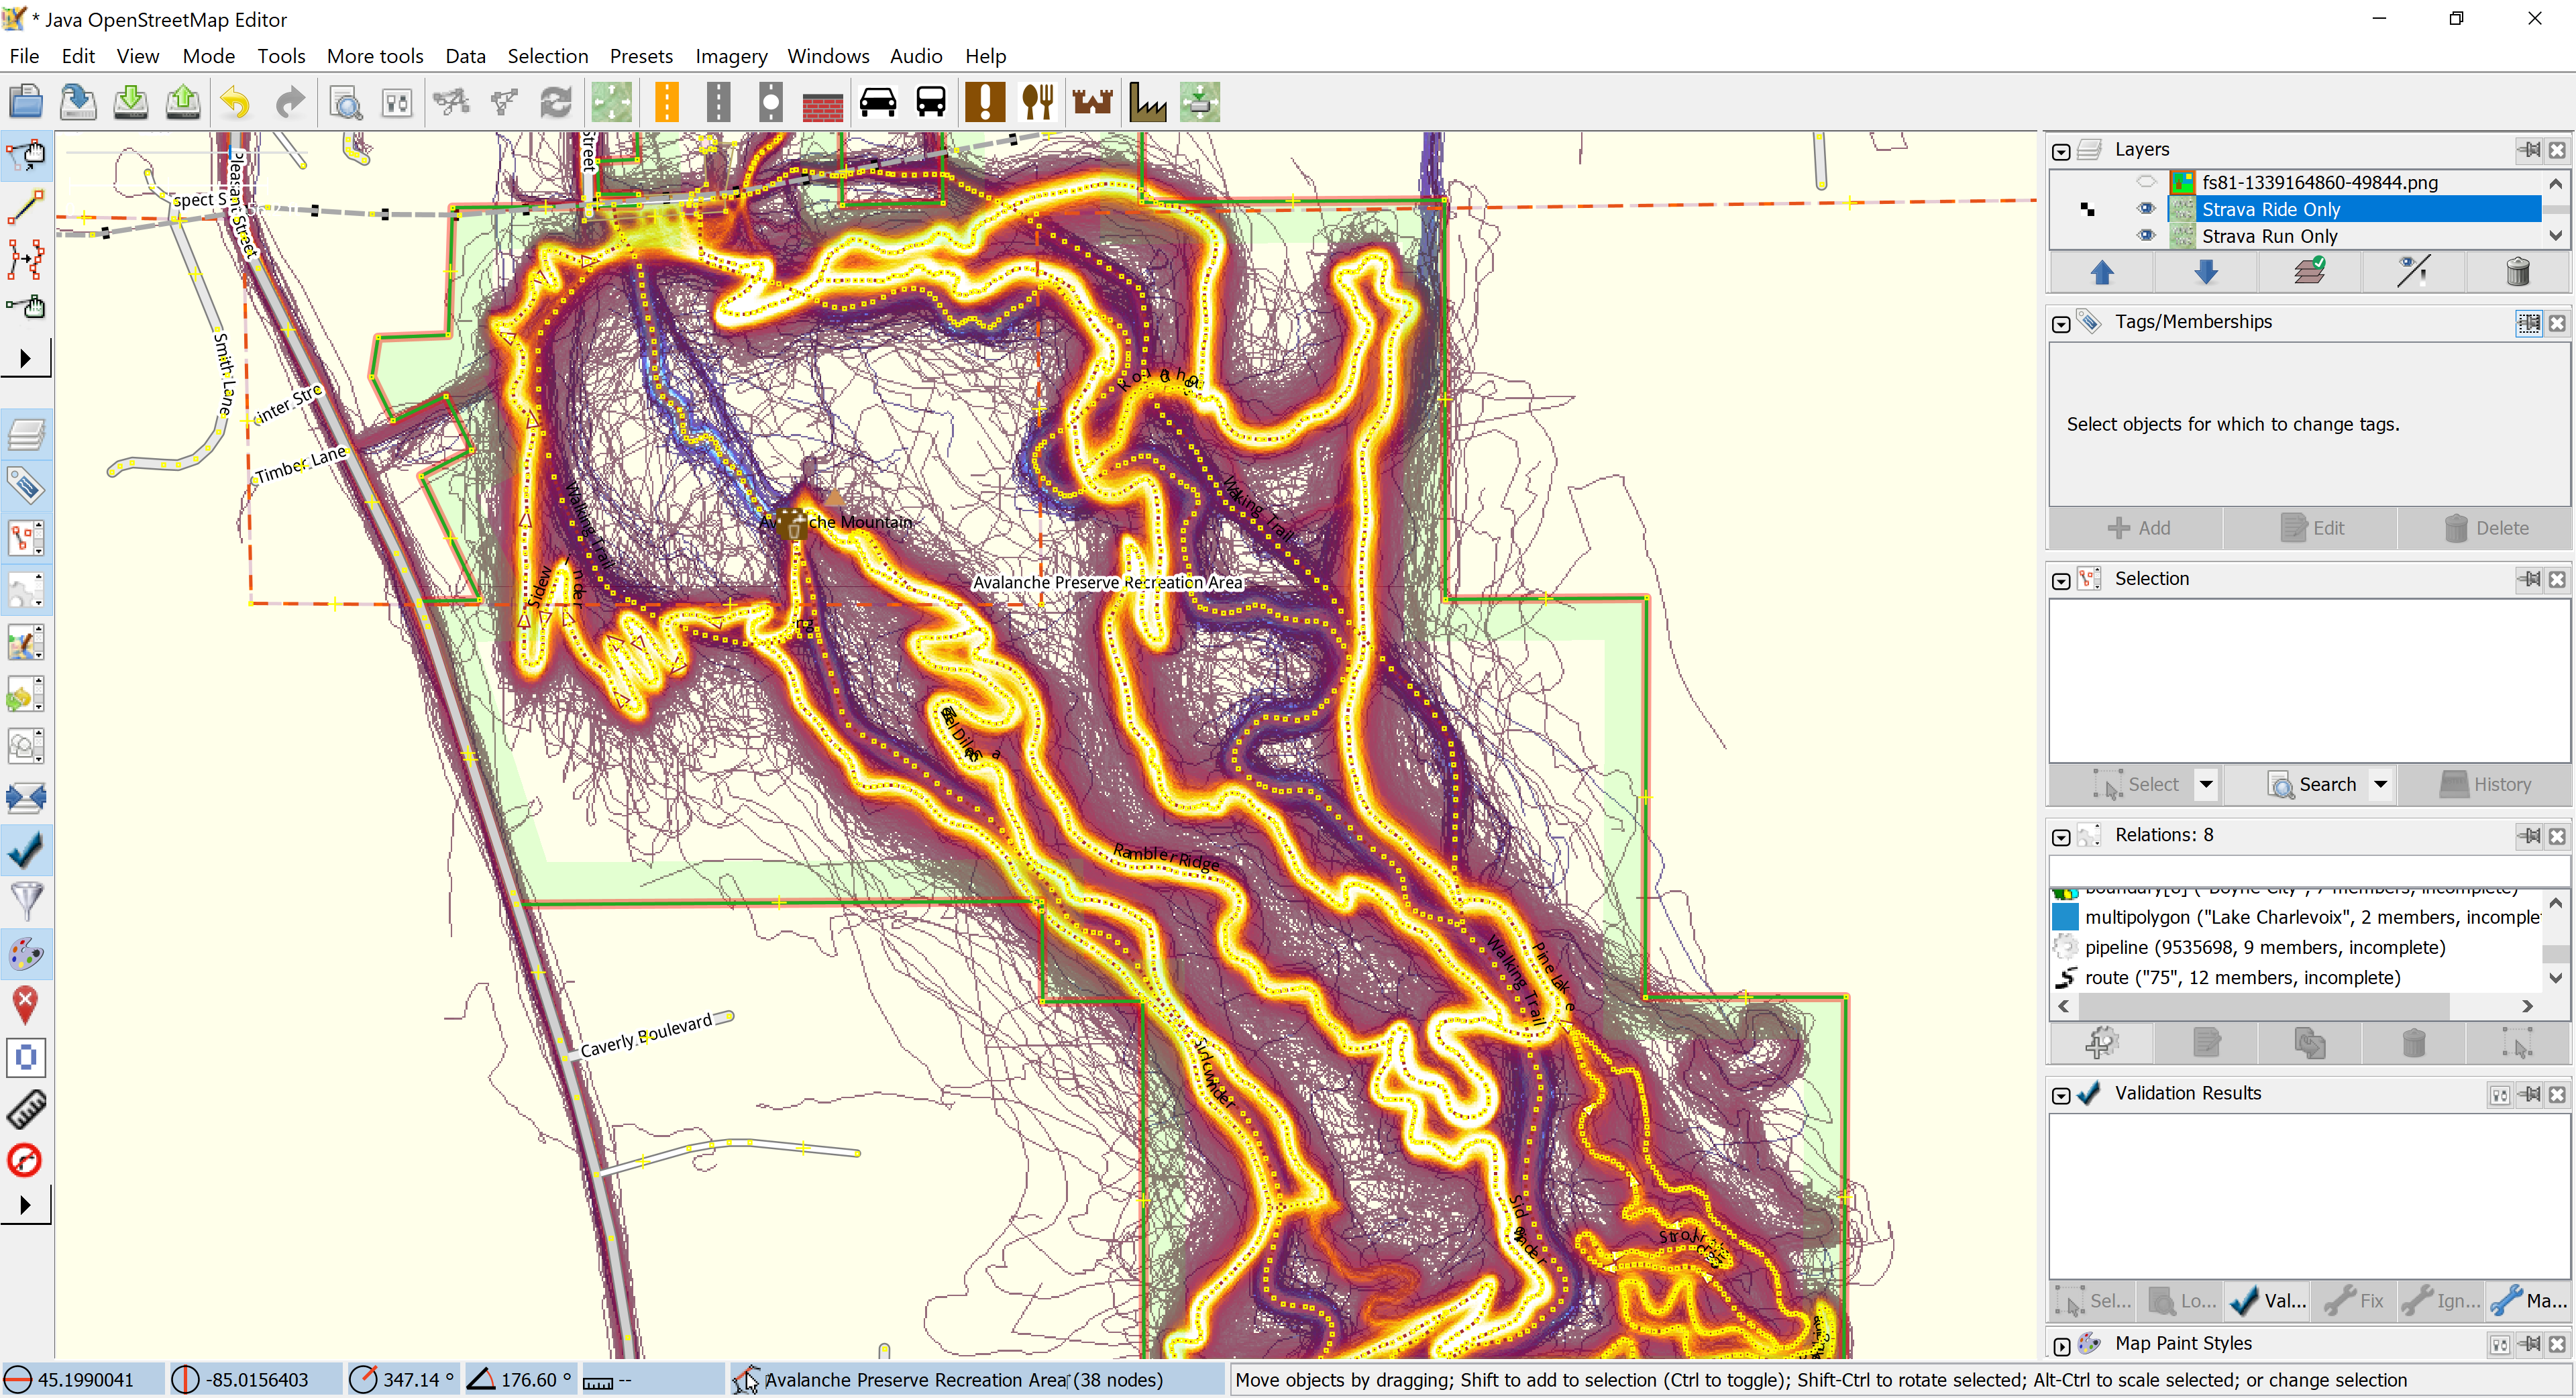
Creating multiple layers, riding-only and running-only, of different colors was extremely useful when mapping Avalanche Preserve Recreation Area in Boyne City as cyclists tend to stick to the mountain bike trails and runners to the hiking trails. While I had orthorectified maps from both the city and TOMMBA, the separate riding and running heatmaps made the routes much clearer. In the example image above (link) I have the Ride data as color Hot and the Run data as color Blue; perfect for illustrating the mountain bike vs. hiking trails.
If you’d like to see this area as an example load the are around changeset 85690641 or a bounding box with the following values and see for yourself:
Many of the popular, long cycling events — or even just solo rides — require a GPS so that one can follow a route in order to navigate. While most of us have bike computers that will show the route, most folks don’t have a GPS with the kind of detailed base maps that become useful for detours, emergencies, or just as an additional tool… Much less something that works when outside of cellular coverage areas.
For this, I recommend you look at offline maps using OsmAnd.
I have (and love) the Garmin Edge 130 as it’s perfect for my riding and training. It’s been great for displaying recording data and following routes from the unmarked 100 mile versions of The Crusher and Barry-Roubaix, to augmenting signage in Marji Gesick and following a route through remote parts of Batchawana River Provincial Park. But occasionally I need a bit more; something to help find a detour around a flooded road, a quick way back to the car in a rainstorm, or just a sanity-check of which branch to take at a fork on the road.
Sure, I could buy a super-high-end bike computer that features detailed base maps, but I rarely need these and don’t want the physically large computer on my bike. So I use my phone, running OsmAnd, loaded with offline maps that display without requiring a data connection. Coupled with putting one’s phone in Airplane mode (turns off the cellular and WiFi radios and saves battery — yet GPS still works) a modern phone will typically get days of battery life while sleeping, with maps and a route quick to access.
Whenever I actually need to see this map I simply pull it out of my pocket or bag, wake it up, get what I need from the map, and carry on. No screwing around with a small touch screen and funky zooming on a Garmin or Wahoo. (I believe that, to date, neither Garmin nor Wahoo have made map perusal as straightforward as it is on a basic mobile phone.)
This is also a great way to get maps on your phone when traveling somewhere costly for cellular data, like during a day-trip to Canada.
Whether you’re doing Marji Gesick or The Crusher or just following a route found on a cycling club’s website, I recommend augmenting your navigation with offline maps in OsmAnd by doing the following:
Visit the OsmAnd site and follow the links to your phone’s store to install the software.
Get a copy of the GPX file on your phone; for Android phones this is often as simple as visiting the download website and downloading the file.
In OsmAnd‘s menu, pick Download Maps and download maps for the regions you want. I personally have Standard Maps, Contour Lines, and Hillshades for Michigan installed all the time, and then if traveling will install for other states/provinces/countries.
Once the offline maps are installed, pick Configure map from the menu, then Map source, and ensure Offline vector maps are selected. The default, OsmAnd (online tiles), is an online map source that requires data.
To display a particular route, pick GPX files…, Add More…, and then browse your phone to add the downloaded GPX file. Ensure this file is enabled (checked), and then go back to the map screen.
You’ll now see the route overlaid on offline maps, easy to zoom in and out of and find your way around. Try turning on Airplane Mode and see that it all still works.
Once I have everything set up, here’s some tips about how I actually use OsmAnd while out on my bike:
If in an area with minimal or no cellular service, put the phone in airplane mode so the battery doesn’t get used up while it searches for a signal.
Turn off all lock features on my phone (fingerprint / pattern / PIN unlock), so I can wake it up with just a press of the power button.
If I’m at a spot where I’m not quite sure which way to turn (based on the single line on my Edge 130), use the map to figure out which branch to turn on. Even the remotest of fire roads and two track are often mapped.
If I think I might have missed a route sign (say, in Marji Gesick) I’ll use OsmAnd to see if I’m still on route, and to get back if needed.
Look for other nearby roads or trails if I need to detour or shortcut back. I had to do this yesterday during the Founders Fall Fondo as part of the 62 mile Barry-Roubaix route was flooded.
Many small, old, sometimes abandoned, yet somewhat navigable roads are still listed in the OpenStreetMap (OSM) data that OsmAnd uses. While these aren’t great for cars and won’t show up on things like Google or Apple Maps, they are often quite useful when on a bike. Look to these for exploring / finding new routes.
Many trails open to mountain bikes are included in the OSM data. This includes all CRAMBA trails and most trails in the NTN and RAMBA areas. (Note: Trailforks is a better source for discovering MTB trails themselves.)
Periodically update maps to get new OSM data. As roads and trails change, maps get updated.
Pay For OsmAnd+ Live ($5.99/year) to get access to more-frequent, automatic map updates and support the open mapping community.
While this is just a basic overview of using OsmAnd and how I use it when cycling; it does a whole lot more including recording routes, navigation, editing map data, sharing location between contacts, and more. Give the online Help and Features a look for more information.
For years I’ve been pretty enthusiastic about OpenStreetMap (OSM) and using it to map trails (MTB and otherwise). While there are a bunch of other ways to map trails online (Google Maps, MTB Project, Trailforks) I have stayed away from contributing to them because of the one-way nature of submissions; your contributed data gets locked behind their license. While MTB Project and Trailforks both claim to allow some manner of reuse of data, it’s nothing as useful as OSM‘s Creative Commons (CC) based licensing. Effectively being the Wikipedia of GIS makes it extremely useful for those of us who want to both contribute data and build open maps on the larger set.
Then suddenly last night I read this article on Pinkbike discussing how they took OSM data, parsed it to highlight mountain biking routes, and are now using it as the base map for their Trailforks mapping site. They built a tool on top of the open data and made something great.
This is really, truly excellent.
This sort of reuse of public, open data in OSM is the exact reason why I contribute to it. The folks at Pinkbike / Trailforks have taken a useful set of data from all over the world, processed it, and made something good. This would not have been possible with the data locked up in Google, MTB Project, or even the stuff contributed directly to Trailforks.
I look forward to where this’ll go. The Pinkbike article mentions that they’ll be reimporting the data a little different in the future, and talks about how they are going to have another article about tagging to better support Trailforks. While OSM has some minimal standards for MTB tagging (eg: mtb:scale:imba) I look forward to a bit more de-facto standard around this.


")
