Introduction
Kristen and I have been spending a good deal of time in the Ishpeming and Negaunee area this year, and I’ve made it a personal goal to become more familiar the local trails — both RAMBA-supported and otherwise — and get them documented OpenStreetMap (OSM). Having these trails in OSM provides two big benefits: they appear in other mapping tools (such as OsmAnd, GaiaGPS, Strava, MapMyRide/MapMyRun) and the trail data can be freely used to build other tools.
Over the years of making trail maps with OpenStreetMap I’ve mostly produced PDFs for printing, leaving mobile and online mapping to other apps. These work well, but have the big downside of rendering routes with their style. That is, online maps via these tools’ show the routes, but look quite different from print maps, even if all the data for them to display more data (such as colour=* tags on relations) is in OSM.
While these apps work pretty well, and I use them myself routinely for navigation, I got the itch to see if I could make a web-based map that looked more like locally produced print maps than app-based renderings. It seemed like a good project, a good way to learn some basics of modern web development, and maybe make something useful.
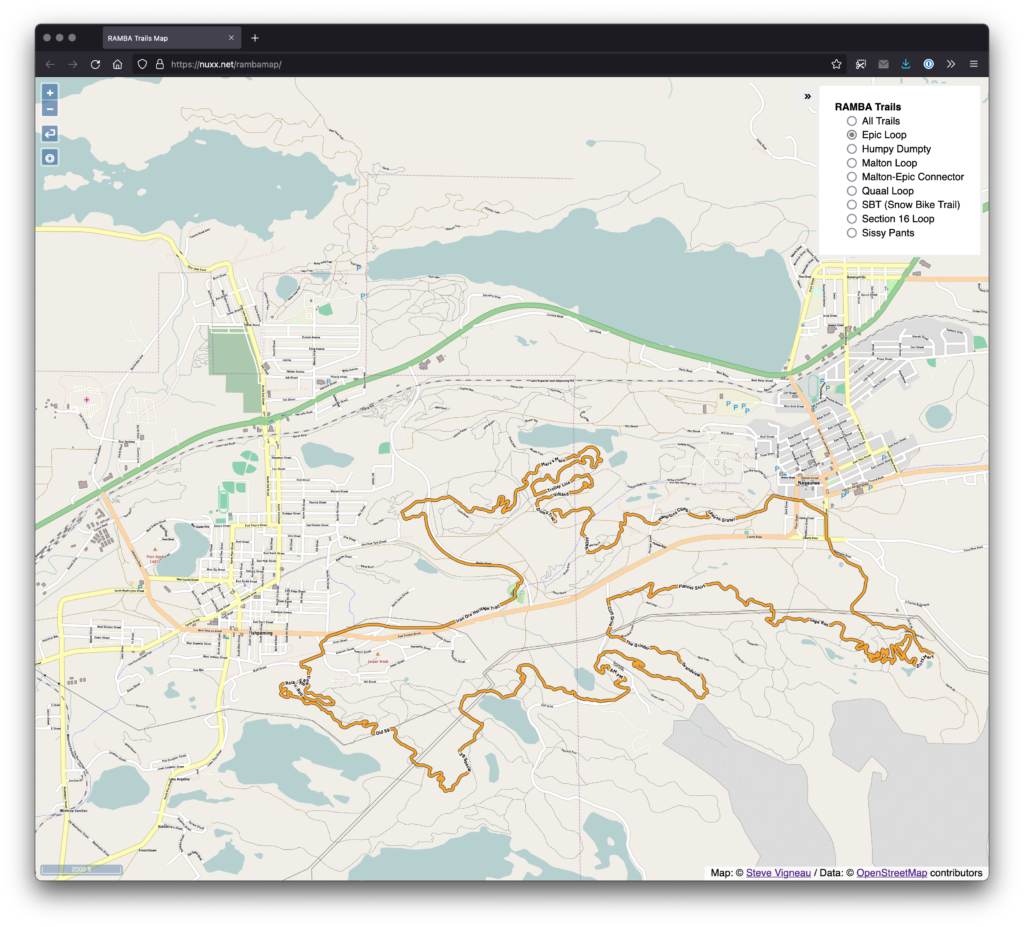
What I ended up with was a slippy map of showing the RAMBA trails that uses layers of pre-rendered tiles to show the different official trail routes, placed over a background map. The map viewer is client-side JavaScript that loads static tiles from a basic web server, making this a very simple app to host (just a bunch of static files on a site).
In this post I intend to document the major steps of how I made this map, why I used the tools I did, and share the code to reproduce (and update) this build. Hopefully this’ll allow others to get their head around these map presentation basics, perhaps even reusing this work to make and host another map.
Update OSM Data
Mostly outside the scope of this article but worth a mention, a significant amount of time was spent ensuring that the RAMBA area trails are accurately listed in OSM. Without good data it would not be possible to go further, as the OSM data is the base data used to create other maps.
By combining information from a bunch of sources, and doing some personal surveying of trails while riding and hiking, I was able to get all of the official RAMBA trails documented, along with numerous other paths and tracks in the area. This building a complete picture of the usable trails in the area.
Information used to get the RAMBA trails in OSM included:
- My own recorded ride/hiking data, notes, etc.
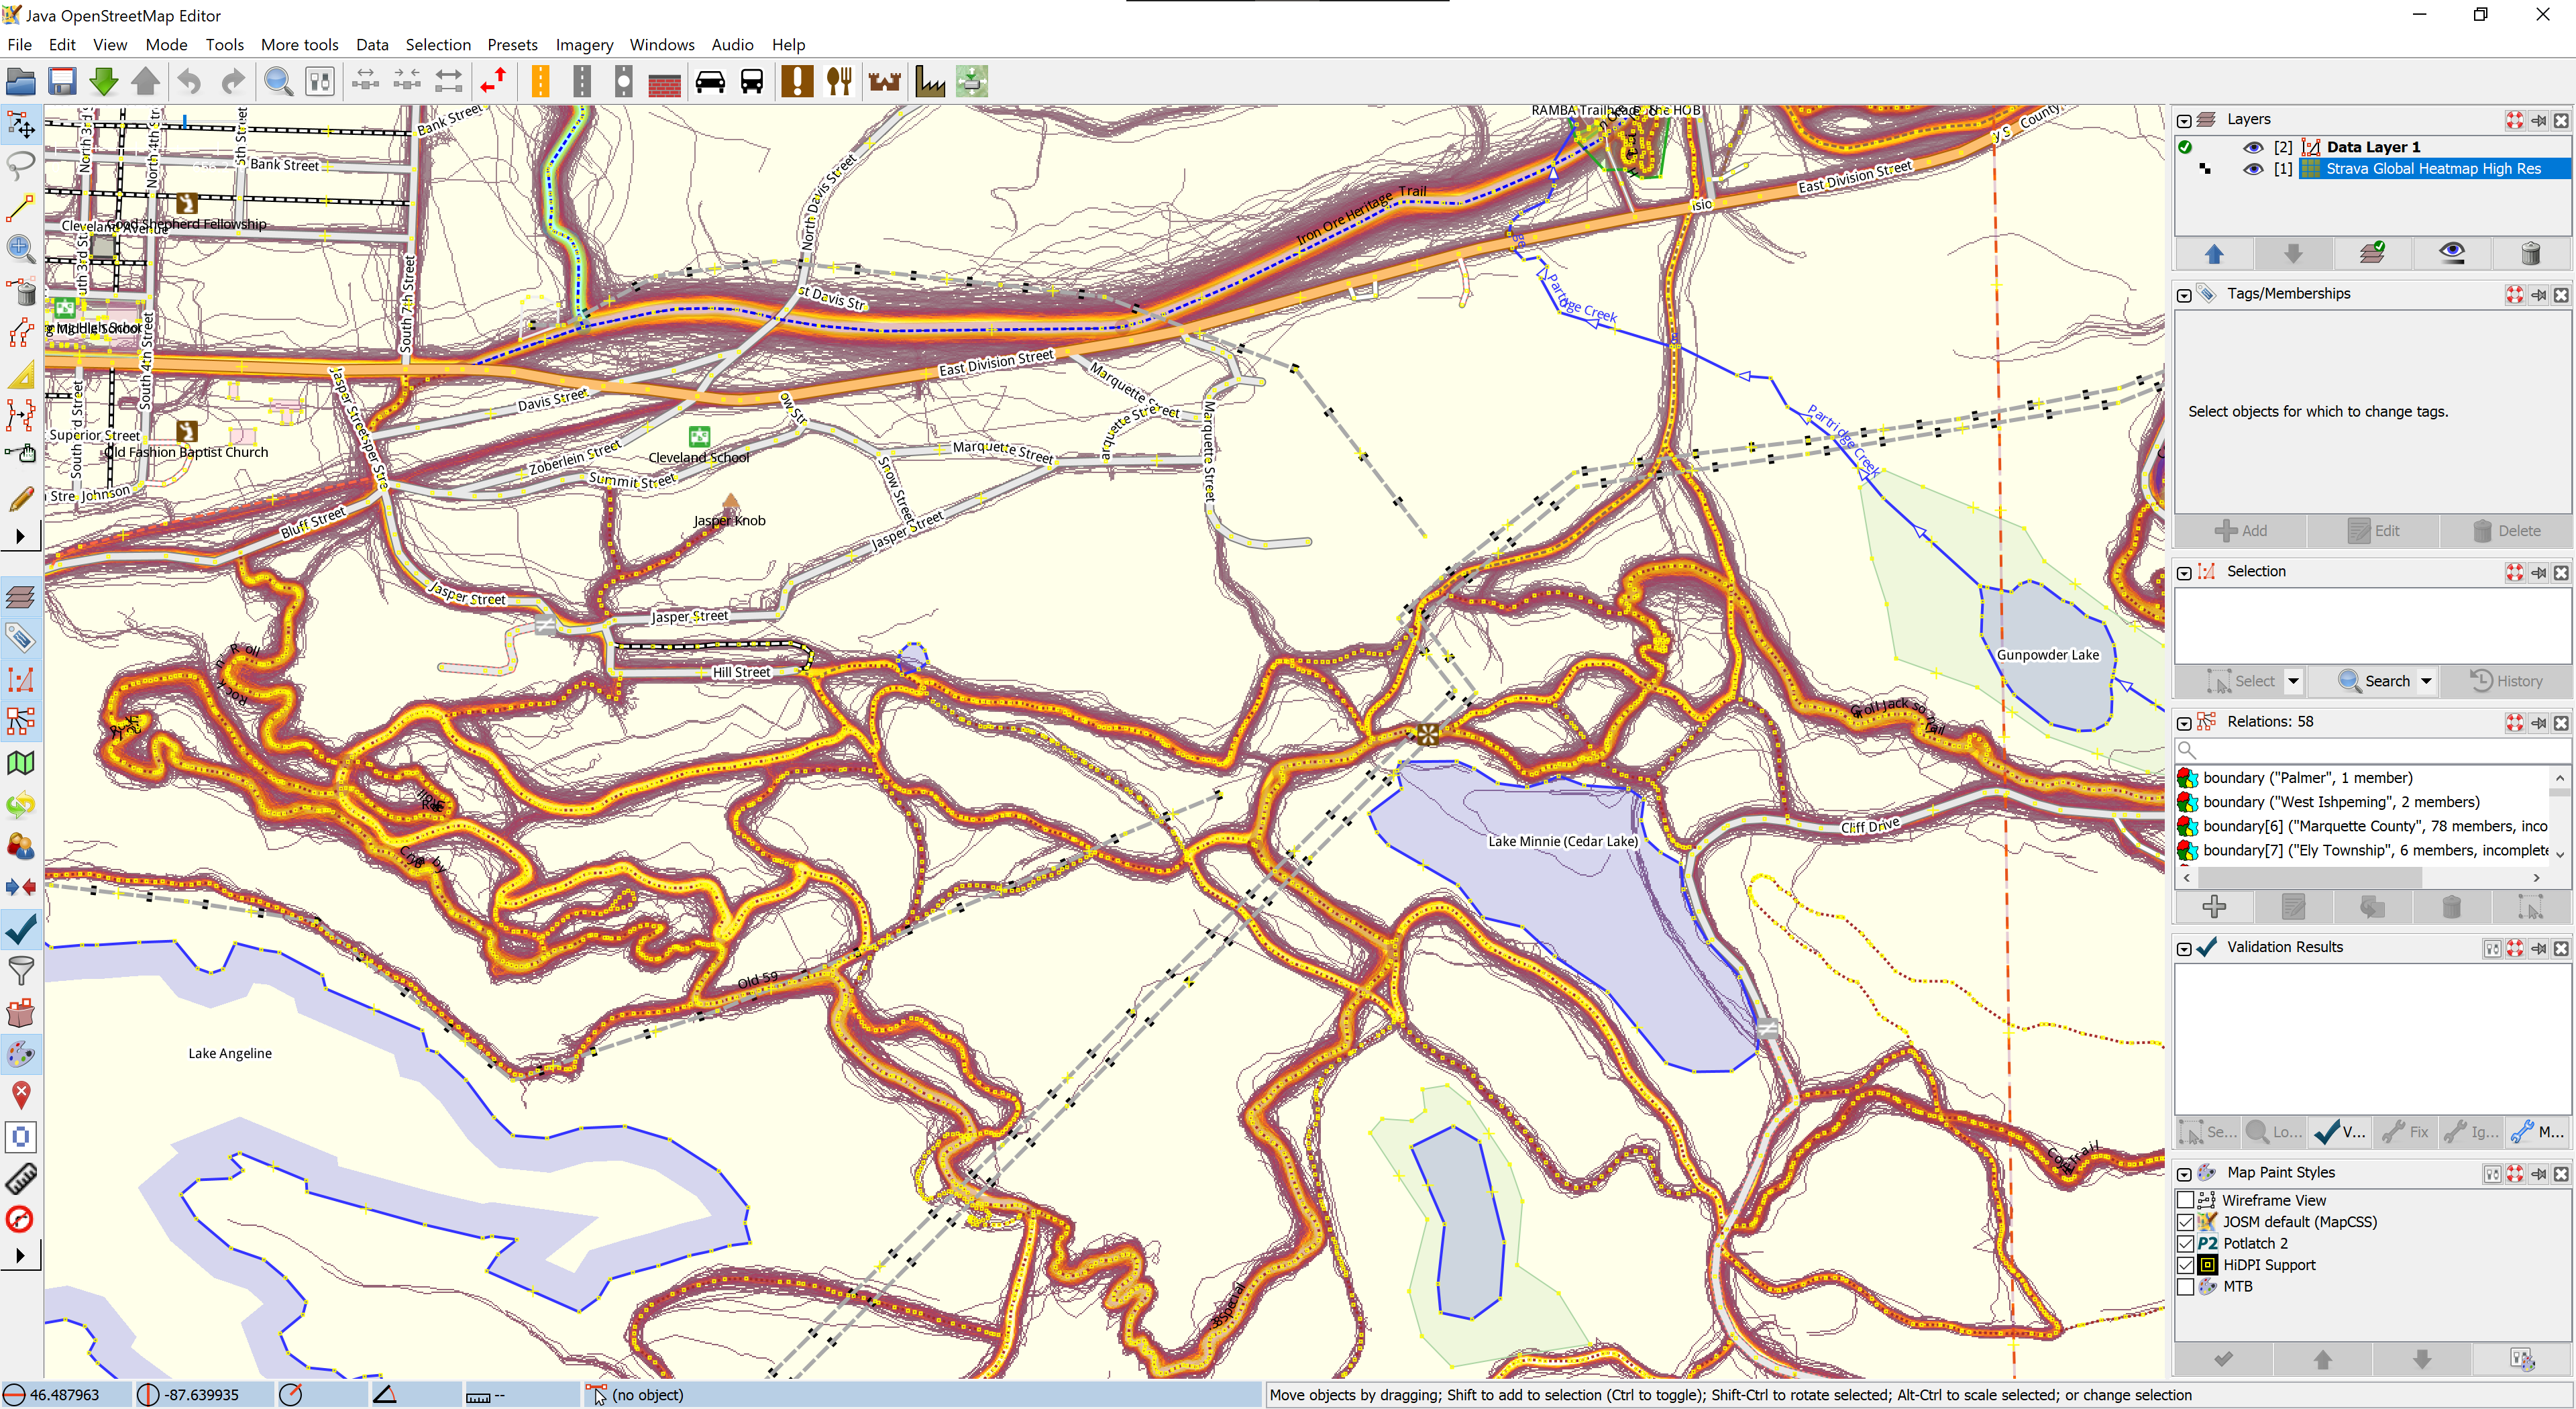
- Strava Heatmap data.
- Official route files (GPXs) from events such as Marji Gesick and Polar Roll.
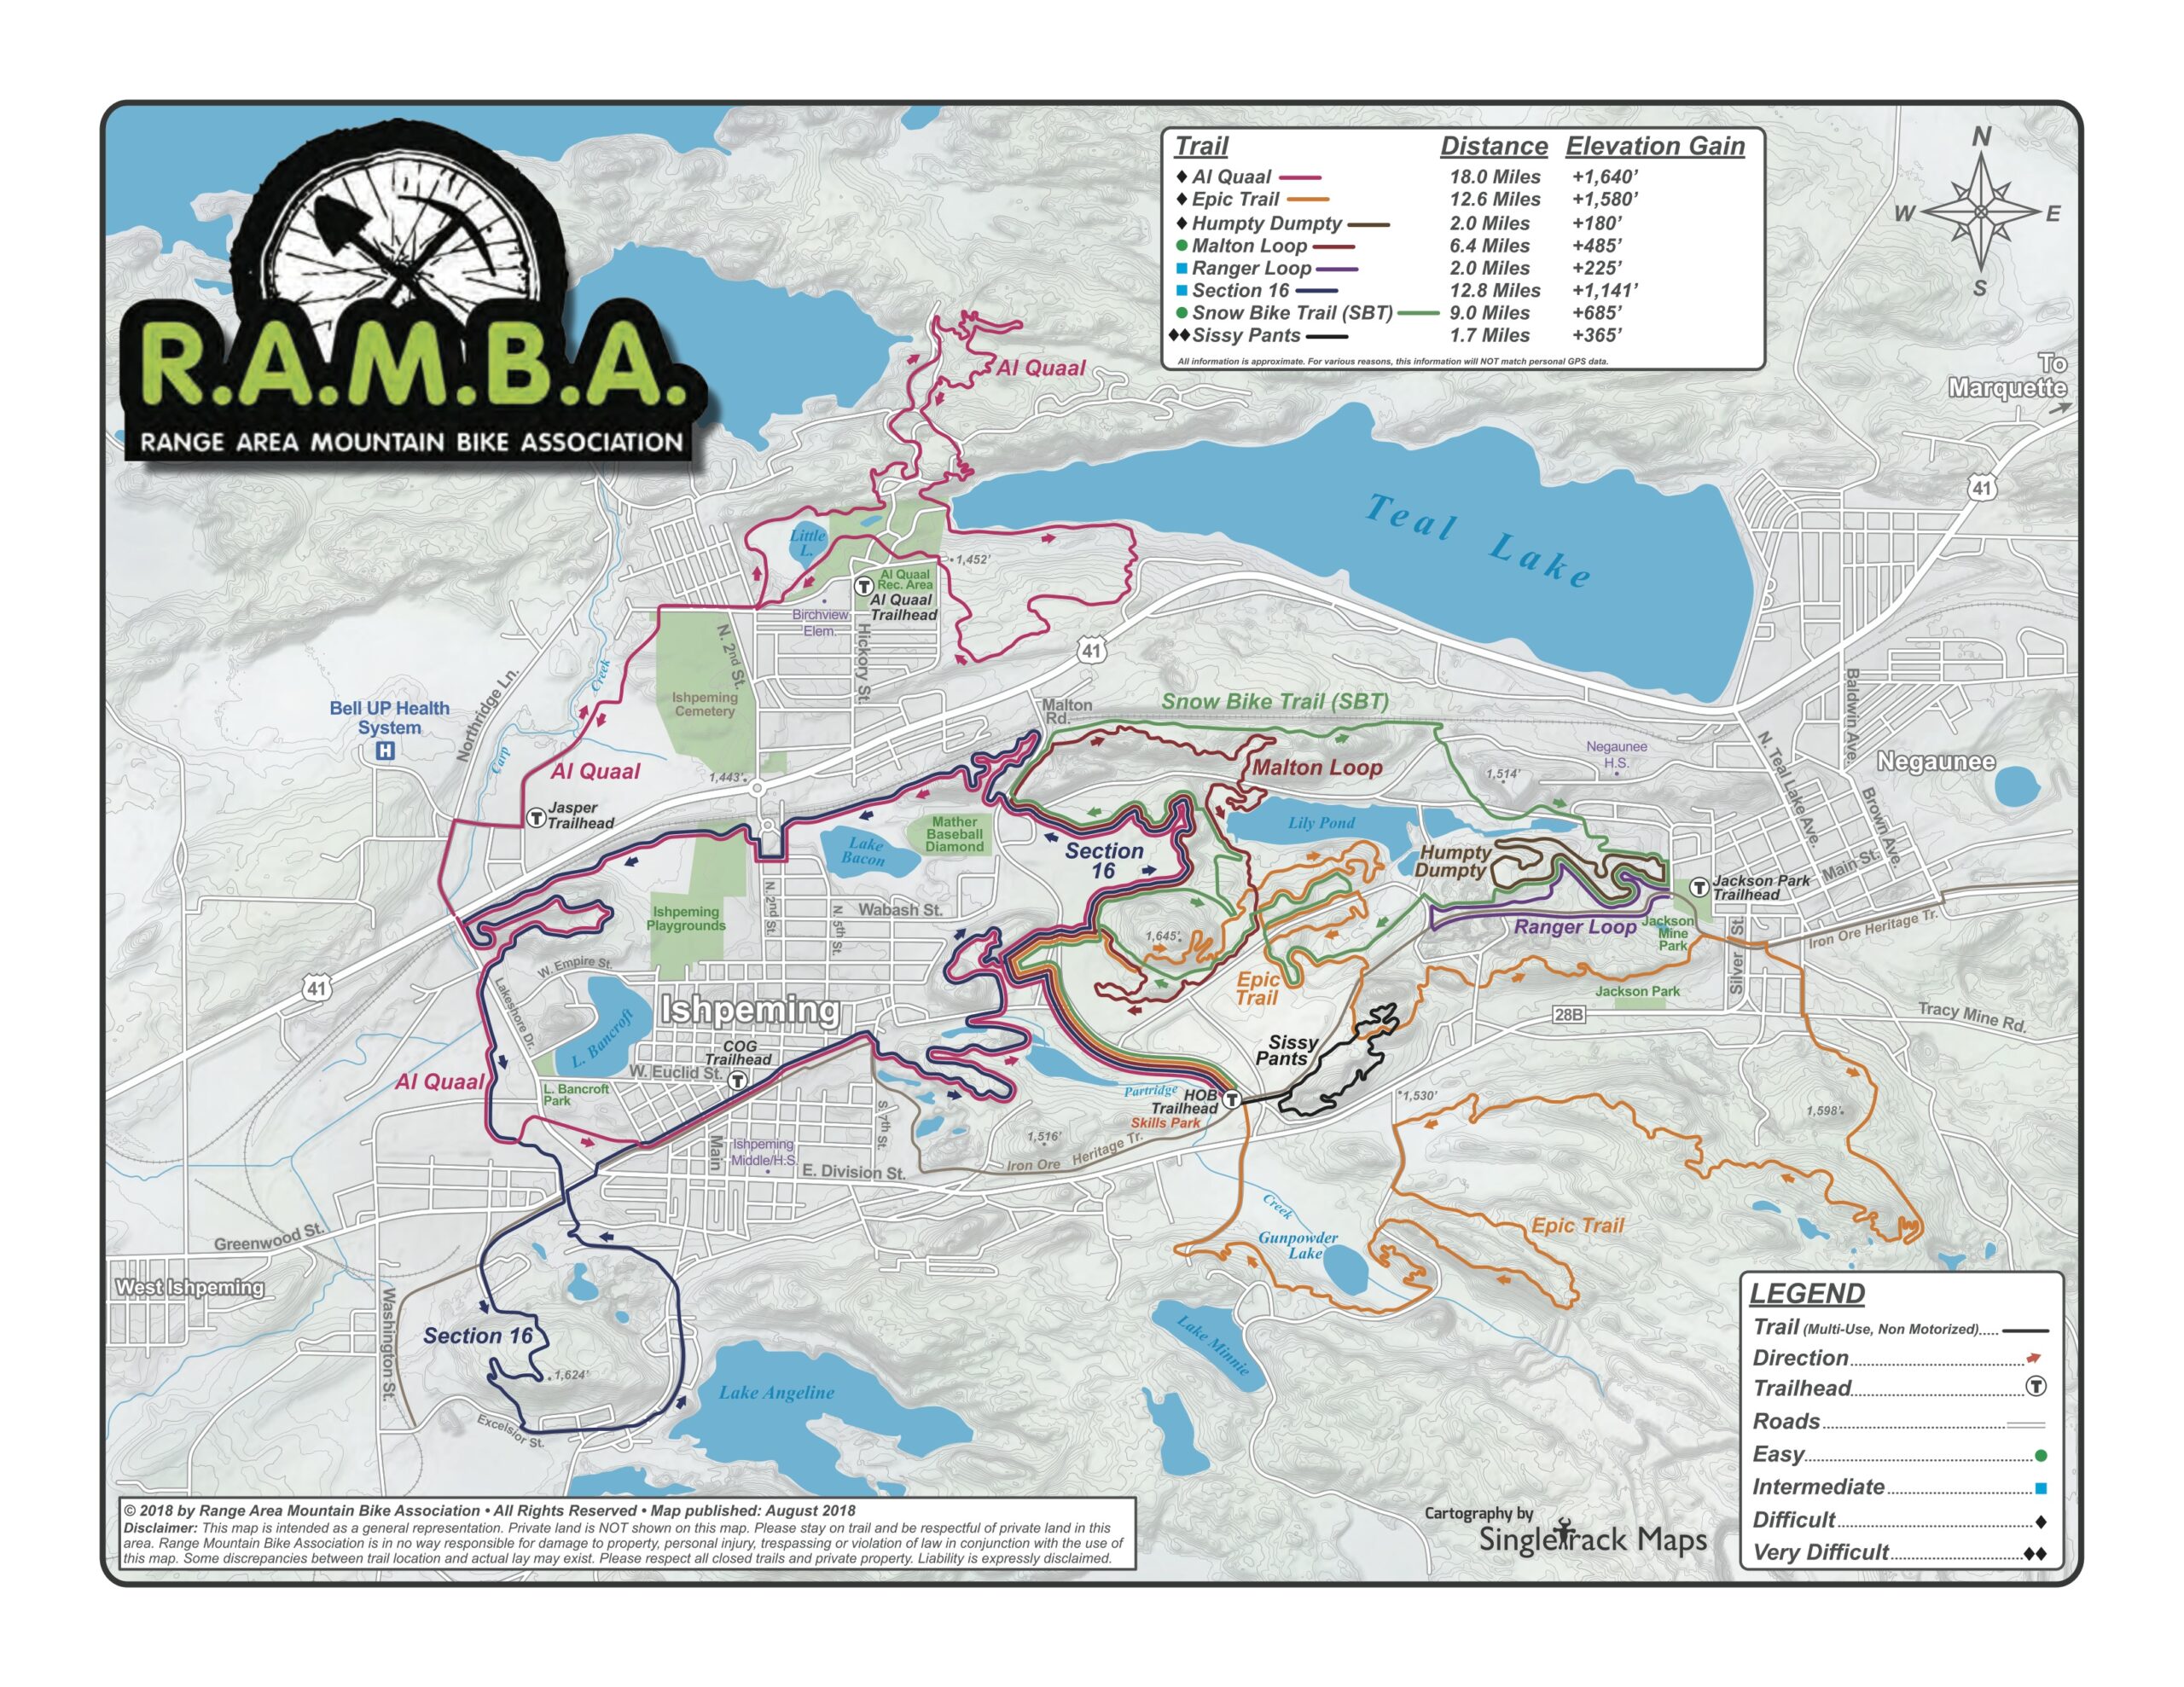
- The official RAMBA map.
- Hand-annotated map from Danny Hill listing local trail names.
These sources were combined in JOSM, cross-referenced, ways drawn and tagged, relations built out, and before long a complete picture of the RAMBA-area trails — official and otherwise — were in OpenStreetMap.
Most importantly, beyond documenting the trail locations, trails were grouped into route relations to show each official route, and then all the official routes were grouped into a superroute for all the RAMBA trails. As of time of writing, relation RAMBA Trails (12425503) is the superroute that aggregates the individual trail routes such as Epic Loop (8467869) and Malton Loop (8468010).
The result of this is accurate trail data that’s easy to query for and style using other tools.
Rendering Tiles with Maperitive
There are myriad ways to render tiles from OSM data, with most of these involving setting up a database server and a toolchain which’ll generate, cache, and serve tiles on demand. For most large data sets this makes a lot of sense, but for a small trail system I really wanted to use static tiles I could serve from a simple webserver.
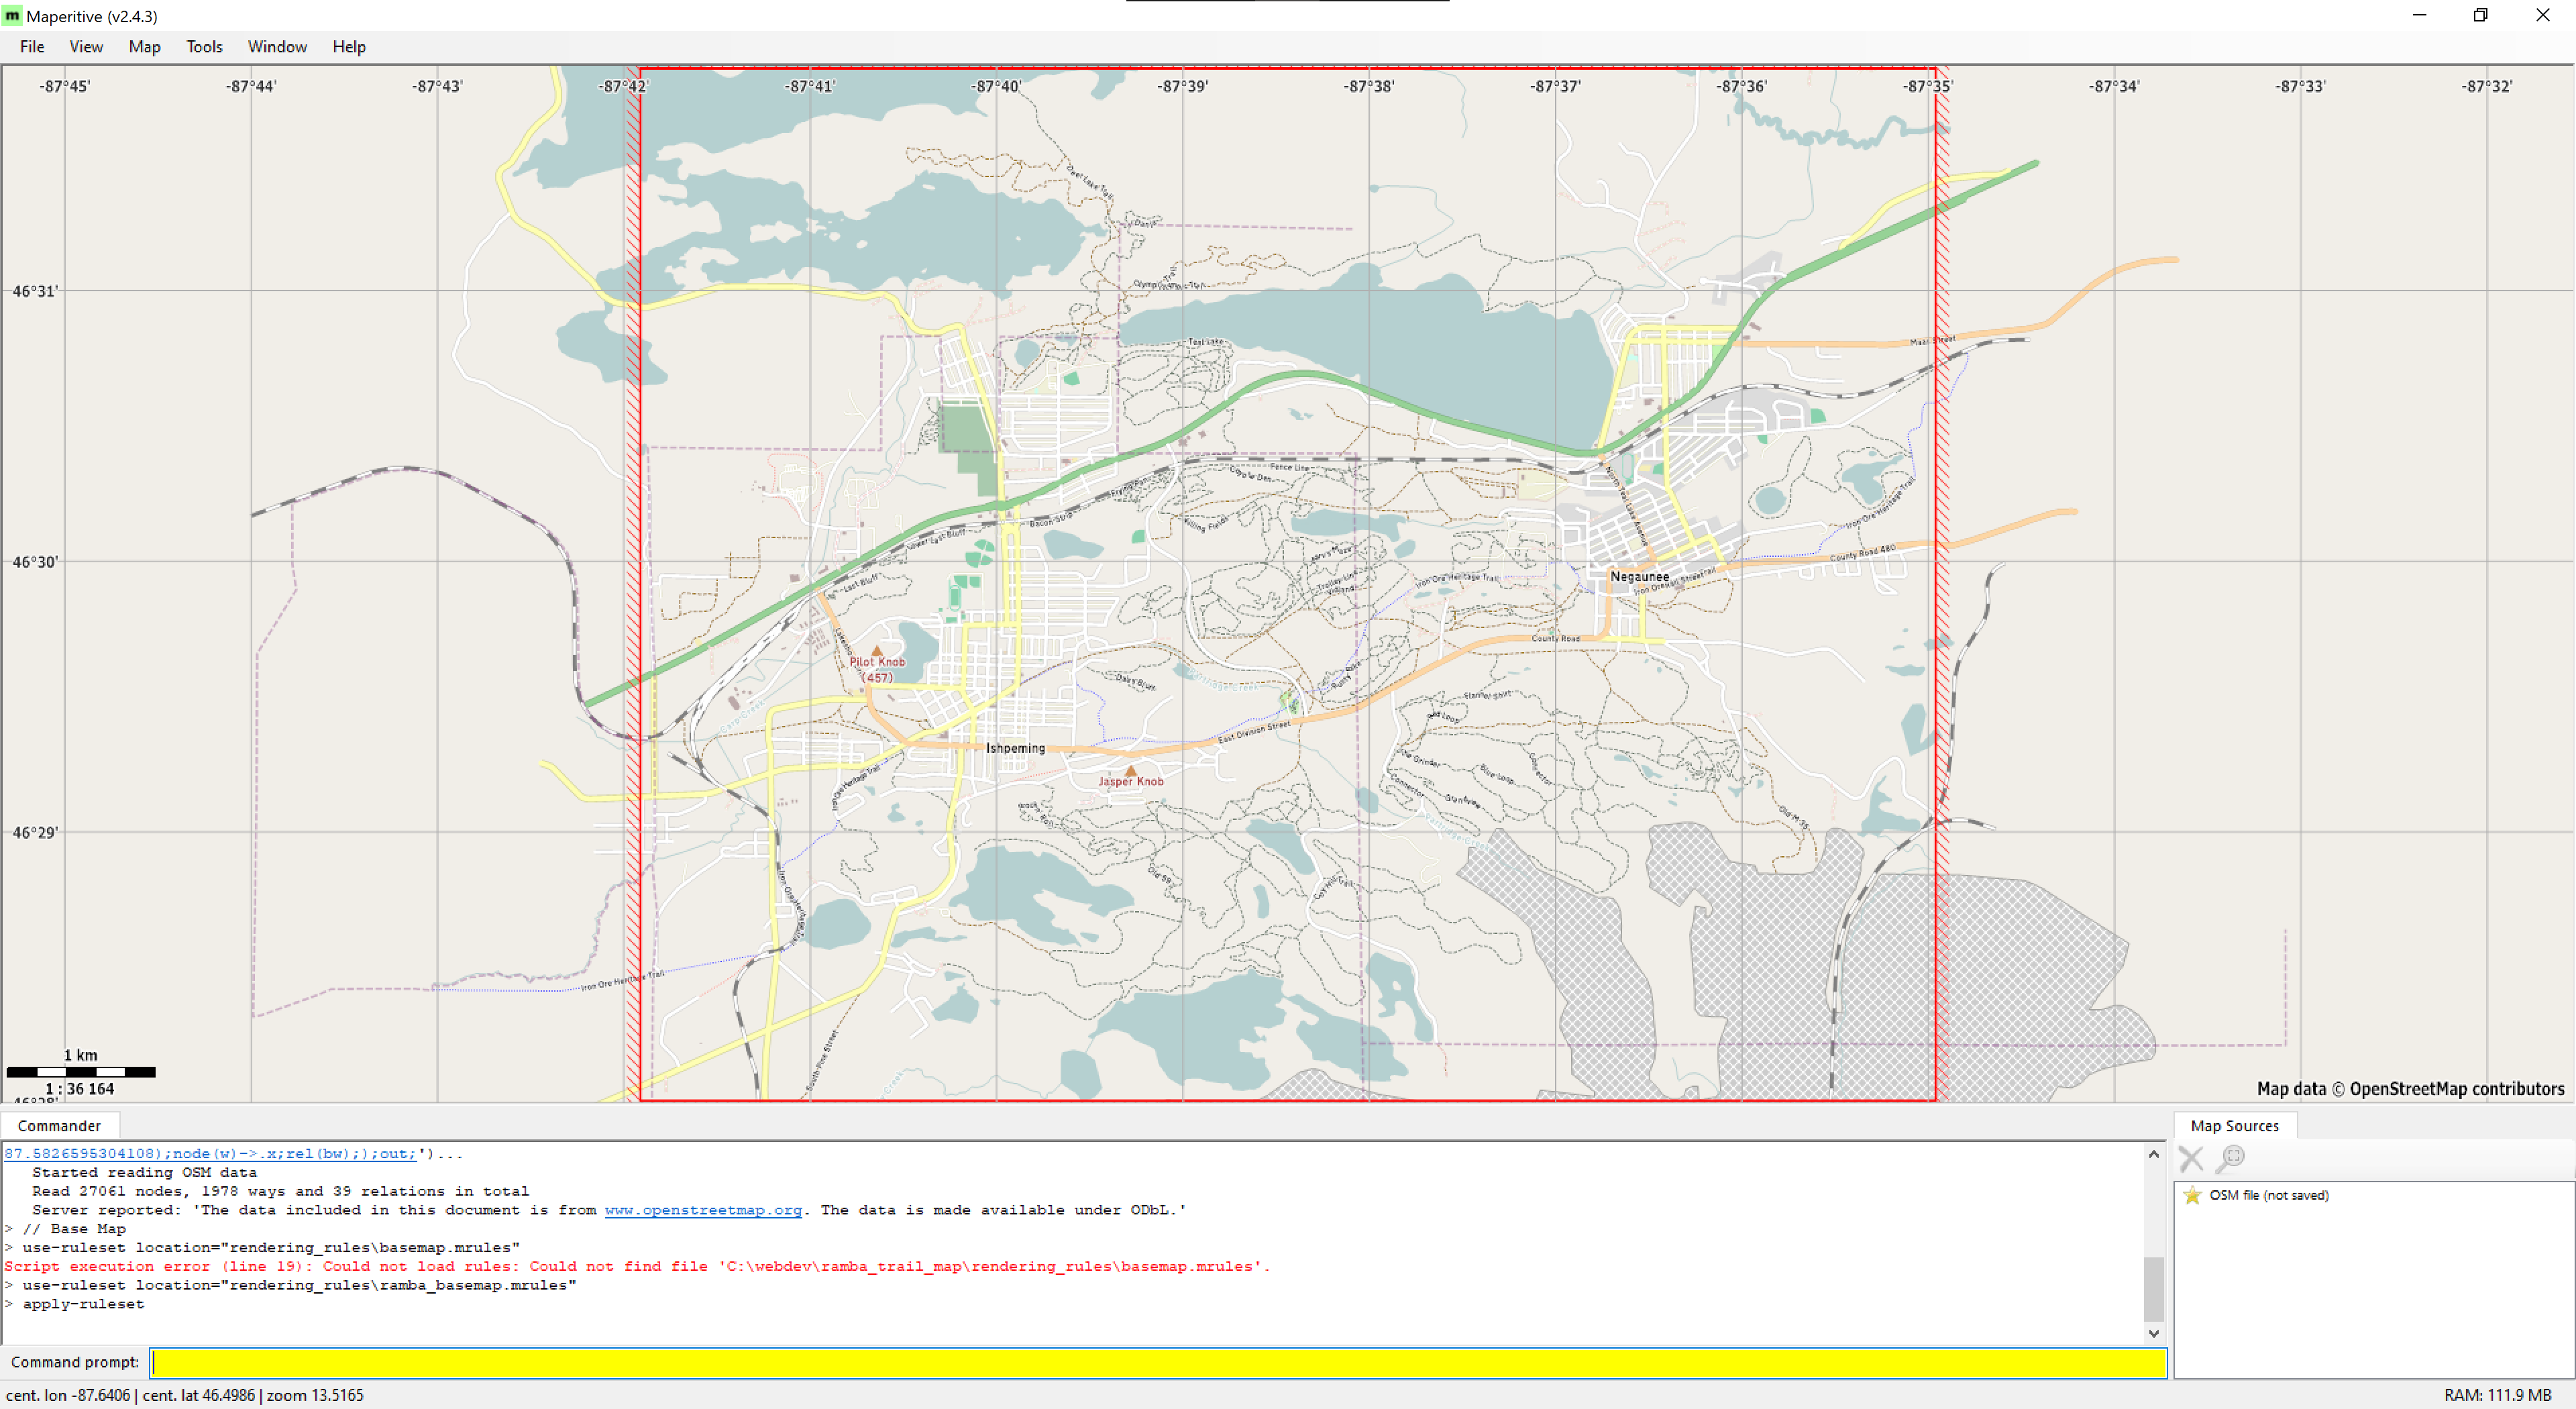
Eventually I came across Maperitive, a desktop application for Windows that takes GIS data (including OSM), stylizes it with a relatively simple ruleset, and can generate tiles in the standard XYZ format for use elsewhere. It can also be scripted, which meant I could use it as part of an automated workflow to generate new tiles as the OSM data changes. This seemed like a good solution, so I set about writing some rulesets that would reasonably show the RAMBA trail routes and some automation around it all.
After a lot of experimenting I settled on a having separate tile set for each of the official loops, an overview of all trails, and a base map. The base map would always be shown, and a user can toggle between layers which highlight all the trails or individual loops.
After a few iterations of custom rules, I settled on a simplified set based on the Default.mrules file which comes with Maperitive for rendering the base map. The only modification was changing the font to Michael Adams’ Roadgeek 2005 Transport Medium font, as it looks nicer than the default, Verdana. For the overview and route layers I created simple rules based on the the default rendering of highway=path, using the Heavy version of the font. The rule for each trail route (relation) selects the trails in a given relation then colors them accordingly.
Creating these rules took a bit of fiddling, as Maperitive is both a bit of a dead project, not completely documented, and (in the latest Beta) sort-of buggy where sometimes the map display would stop updating. Still, even though I’m not great at making attractive things, I was able to come up with something that worked well enough.
Conveniently, Maperitive also comes with a command line version (Maperitive.Console.exe). After settling on rendering rules and a tile generation script, I used this as part of an automated workflow which downloaded OSM data directly then rendered each of the tile sets.
After tile generation I used a Windows binary of OptiPNG to losslessly compress the tiles, resulting in a ~62% space savings (original: 746MB, optimized: 286MB) which’ll reduce storage and bandwidth overhead.
The Front End
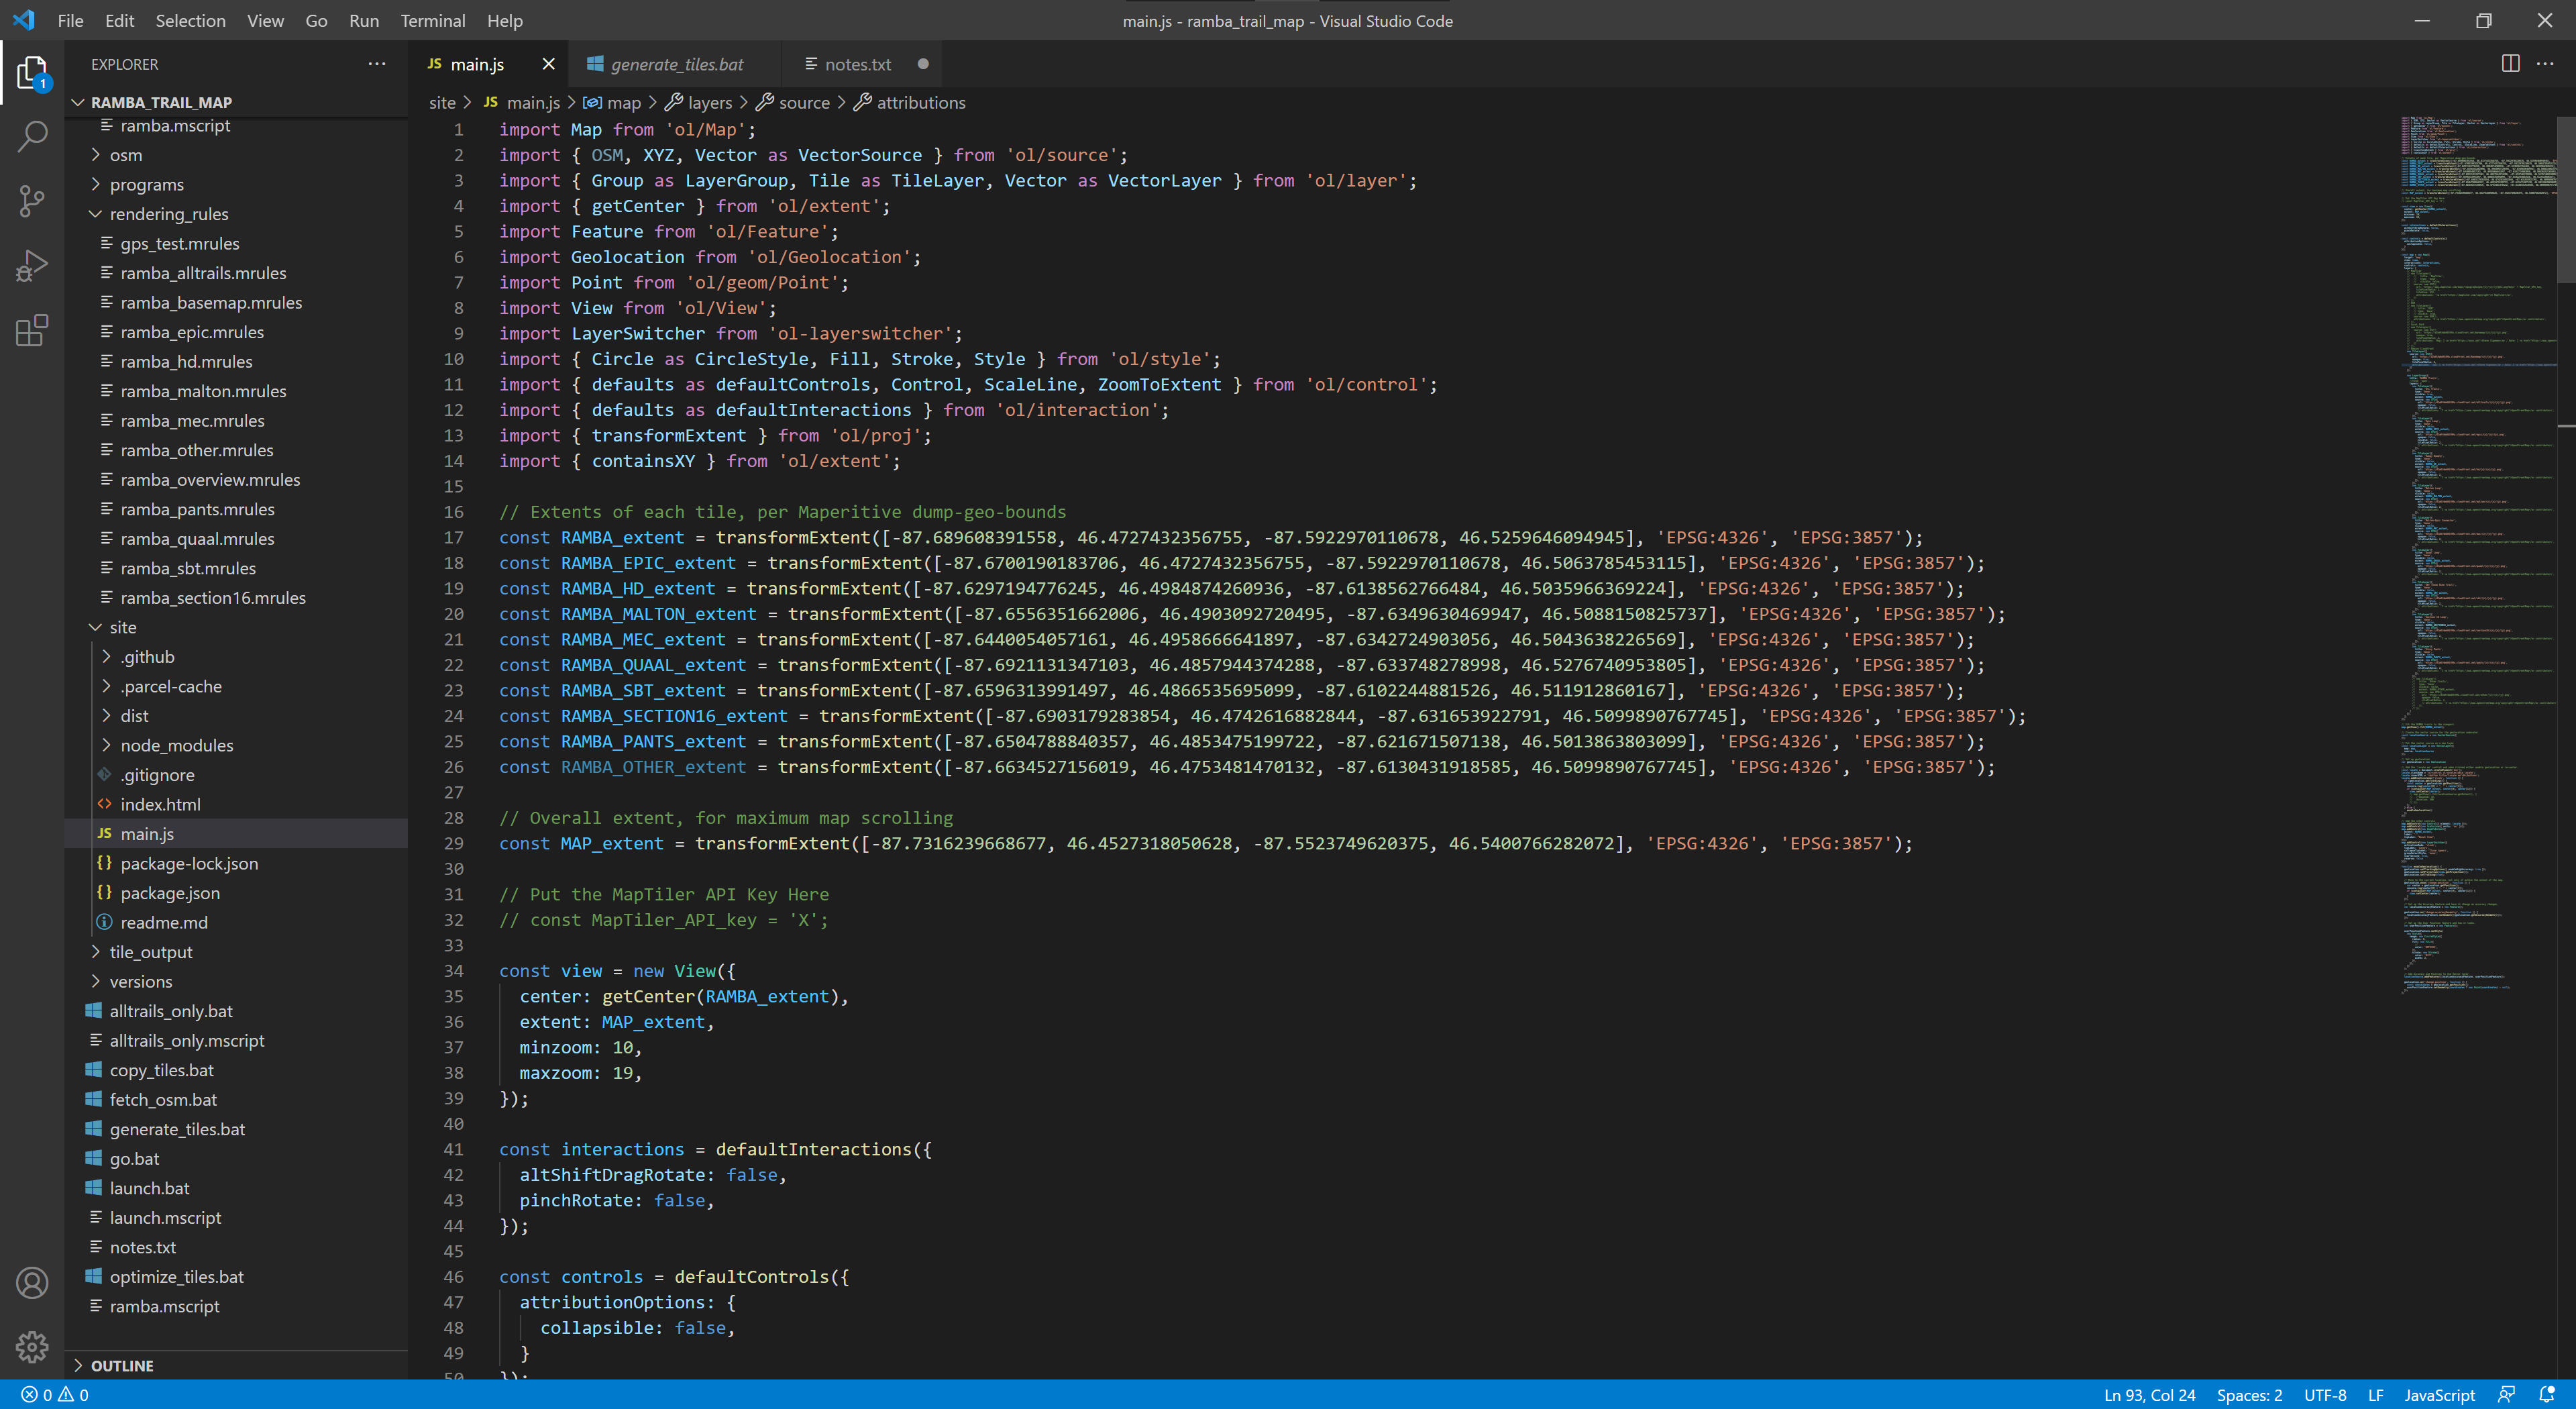
With tiles generated I needed a way to display them. It turns out that OpenLayers was easy to use and it all ran as simple client side application in a browser. By using npm and parcel, with Visual Studio Code for editing, it was quite easy to get the site developed, tested, and bundled up for deployment. The only component I had to add was ol-layerswitcher control, which provides an easy way to toggle between layers.
Prior to this I had very little experience with modern web development, with my exposure to JavaScript pretty much limited to reading others’ code to figure out what it’s doing. After a bit of confusion (and having to accept the hidden complexity of using an application bundler), I was able to focus solely on writing a single main.js file with a basic index.html that together do what I wanted:
- Run full screen by default.
- Show all trails by default, with toggles for the defined routes (layers of the map).
- Show an attractive background map below the routes to show the rest of the area.
- Offer controls to use geolocation to showing one’s location on the map and reset the view to the original map extents.
- Look sane on desktop and mobile devices.
This ended up being much easier than I thought, and between the OpenLayers Examples and just some basic programming I was able to get something I’m happy with. Far more time was spent designing the tiles and thinking about what I wanted it to do than writing the code to display it all.
Tile Hosting
The actual map tiles are a number of small PNG files, and a typical session of viewing and panning around the map can result in hundreds of image loads. This was seeming a bit slow when being served from nuxx.net via HTTP/1.1, so I looked into using HTTP/2 to improve performance.
Unfortunately, it was not simple to turn on HTTP/2 here at nuxx.net as I’m using PHP for WordPress, which in turn requires MPM prefork, which precludes mod_http2. I could have set up another web server and such, but for now I’m hosting the tiles in AWS, with the tiles uploaded to an S3 bucket and served via CloudFront.
This should allow for better tile download performance than what I can do from my server. Despite potentially incurring a bit of a financial cost it is a good experiment in hosting tiles in the cloud. I may change this in the future, particularly if it becomes cost prohibitive, but for now it’s working well.
Follow Along At Home
If you would like to generate this same map, start by downloading this ZIP file: ramba_trails_map_code_1.0.zip. It contains the scripts and rules needed to generate the map tiles (ramba.mscript and the .mrules files), the index.html, main.js, and package.json for the OpenLayers-based front end, the .osm file used to generate the first release of the map, and a few batch files that tie it all together.
You will need to download Maperitive (latest beta: link — from this post / mirror), curl, OptiPNG, and the Roadgeek 2005 fonts to generate and optimize the tiles. These scripts may work fine with older/release versions of Maperitive, but betas incorporate a bit of collision detection for text, making things look nicer.
These batch files are included to will help you out, but may need some editing to fit on your environment:
fetch_osm.bat: Uses curl to download all OSM data within a bounding box that encompasses the Ishpeming/Negaunee area.generate_tiles.bat: Runsramba.mscriptviaMaperitive.Console.exeto generate the tiles.optimize_tiles.bat: Copies the unoptimized tiles from the.../tile_output/rawoutput directory to the.../tile_output/optimizeddirectory, then runs OptiPNG against the tiles to optimize them in place.
To build the web app you’ll need to install npm, parcel, create a new OpenLayers app as per the directions here. Then install ol-layerswitcher (npm install ol-layerswitcher), replace the default index.html, main.js, and package.json with the ones I provided, and you should be ready to go.
Updating the Map
As you can see, the map is two major pieces: the front end and the tiles. Whenever the map data changes in OSM the tiles can be regenerated to update those layers. The code for the front end web app only needs to change if the storage location changes, features are going to be added, etc.
Conclusion
This map has worked out rather well and I’m happy calling it v1.0. It’s been a great learning experience, and I’ve even managed to produce something useful that didn’t exist before: an interactive map of some of the most rugged single track trails in Michigan; one of my favorite places to ride mountain bikes.
It’s far from perfect, and there are some things I could do differently, but for now, I’m considering it a success. When in Negaunee for vacation last week I successfully used development versions of this map to find my way around, so I know it’s better than nothing.
If you find any quirks in the map data — such as trails with wrong names or in the wrong location — please take a screenshot and show me what’s wrong and email that to steve@nuxx.net. I’ve done my best to ensure the RAMBA trails are accurately mapped, but I’ve certainly missed some things.
Problems
- No key or other ancillary information (such as logos) as are normally found on print maps.
- No terrain. While 1m DEM elevation data is available from the USGS, I couldn’t figure out how to use it in Maperitive for generating hillshading.
- No easy way to add clickable items to show additional info, link to external map apps (eg: for navigation).
- Maperitive’s text rendering isn’t the best, resulting in goofy looking text at some zoom levels.
- Long trails only have one label placed on the middle. Trails with one name broken into multiple ways will be labeled numerous times.
- Due to being run in a browser it’s a sufficient, but not great, mobile experience. Specifically, selecting the geolocation, recenter, and layer controls can be fiddly because they are so small.
- Does not work offline, but thankfully most of the RAMBA area now has good mobile data coverage.
Things To Investigate
- Keep an eye on AWS cost and performance.
- Look at Leaflet for the front end, as it seems a bit more modern.
- Consider rendering map tiles with TileMill. This will add a lot of complexity both in setup and styling tiles, but once done should allow a lot more flexibility in styling and overcome most of Maperitive’s problems. mapbox/mbutil should work for getting XYZ PNGs out of MBTiles files.
- Consider using a tile server if I don’t want to deal with discrete files.
- Look more into using vector tiles with client-side styling. (I passed on this for now, as a GeoJSON file showing each of the route is a large download and had no benefit over raster tiles.)
- Maperitive should run under Mono, and OptiPNG is available for many platforms, meaning it should be possible to reproduce this build under macOS or Linux. Note that the GUI for Maperitive will not currently run on macOS due to Windows.Forms currently being based on Carbon, which is not available for 64-bit macOS. So while the CLI should work, the GUI version isn’t currently compatible with macOS 11.5 (Big Sur) and higher.