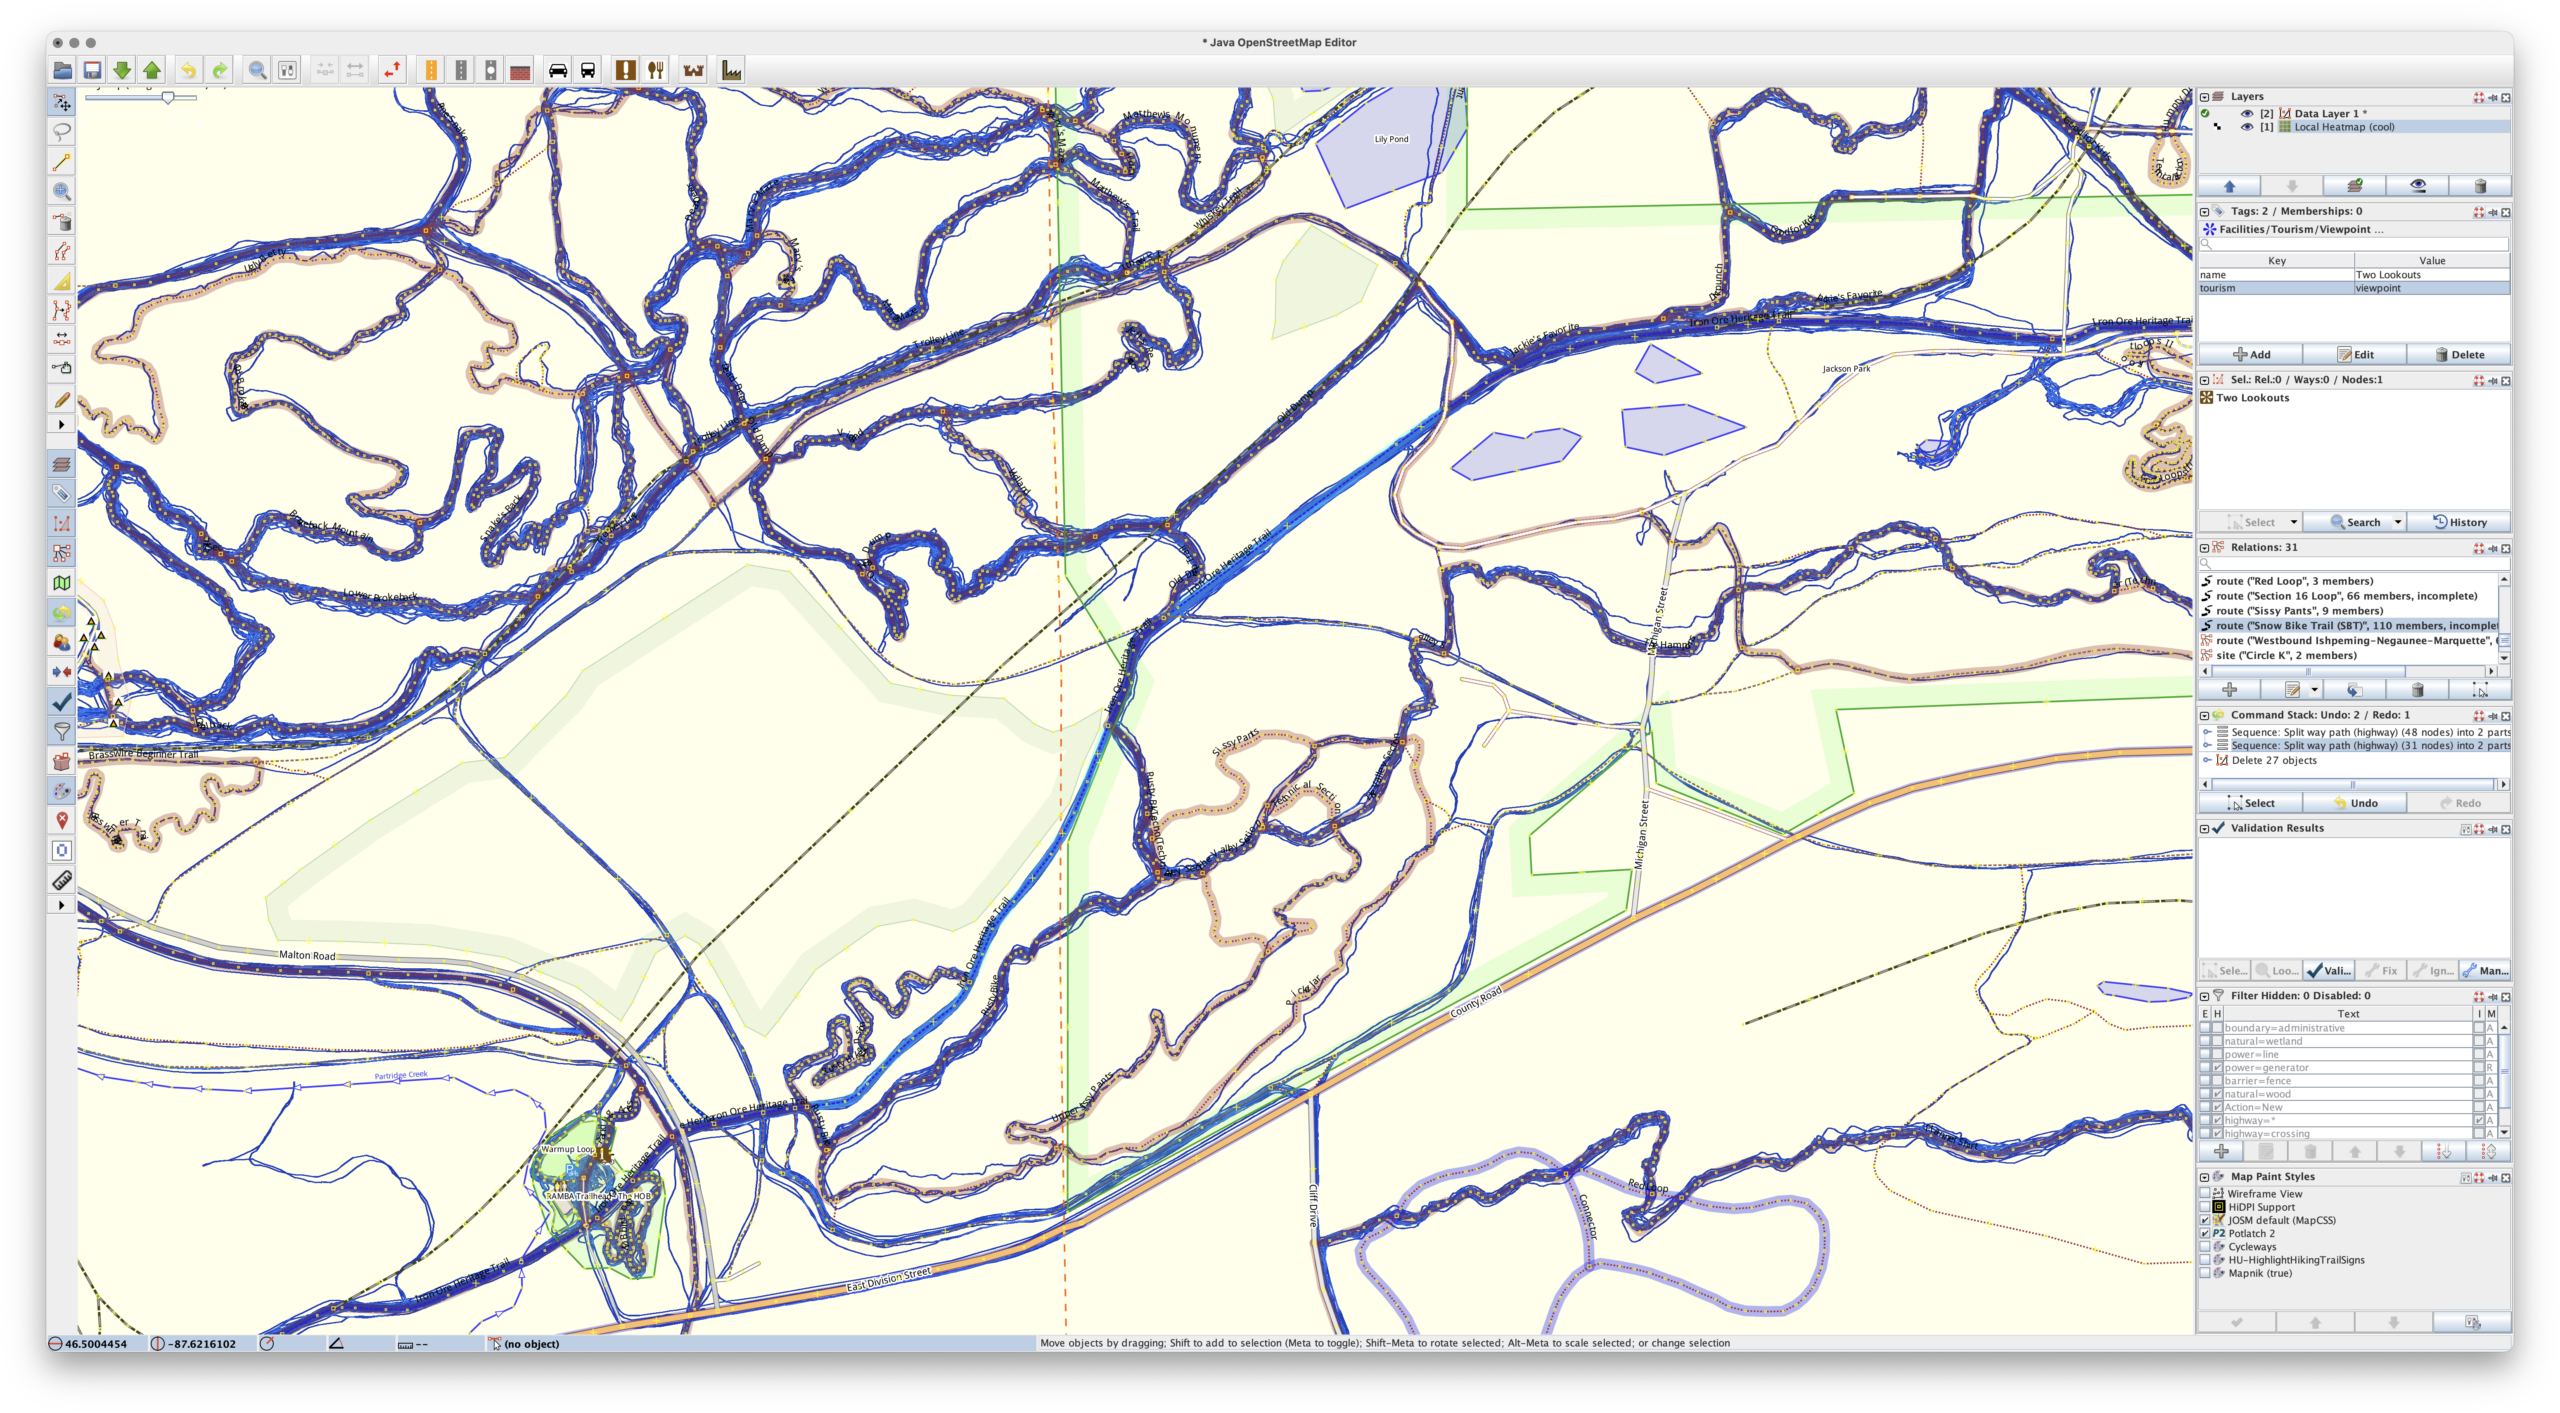
During a long drive to (and from) Florida, and a lot of thinking about maps, I realized something that I really wanted, and something that I could use AI-assisted development to experiment with: generating a heatmap from all my personal, archived activity files. Specifically, generating XYZ tiles, making them available via TMS (so they can be used as an imagery layer in JOSM), and also displaying them on a slippy map.
For years I’ve been using the Strava heatmap as a layer in JOSM for OpenStreetMap (OSM) editing and this works great, but I’m finding myself disconnecting from online social networks, including Strava, more and more. And while the Strava Global heatmap does work as a data layer with a free account, I began thinking about other options to use it, and other cloud providers, less and less. And yes, there’s similar offerings from RideWithGPS and whatnot, but I really wanted to generate my own since it’d give me a lot more flexibility.
So, for my next project working with Claude, I decided to try building a personal heatmap generation tool. And it worked.
Using AI tools to develop software is nothing new, but I’ve never really been one to jump right on brand-new things, instead waiting for them to bake and show their utility before I dig in and use/learn them. I also find it very difficult to learn any tool or system unless I have a way to apply it. But when I do, getting my head around it comes pretty quickly.
In making this I’ve learned / found / finally-realized that with a known set of inputs, a desired output, an ability to identify/recognize bugs, and a task that’s known-possible, AI-assisted development saves can save incredible amount of time. Within reason it makes it possible for me to be more of a product manager than developer. Since I’m not really a developer (my career is in systems management and troubleshooting), that work for me is slow… and I’m not good at it.
Using Claude on the desktop to write the code, VS Code to read and make a few manual edits, and Docker Desktop so I could keep an eye on things, after about a week of free-time iterating, this is what I came up with, and I’m quite pleased:
c0nsumer/local-heatmap-tile-server
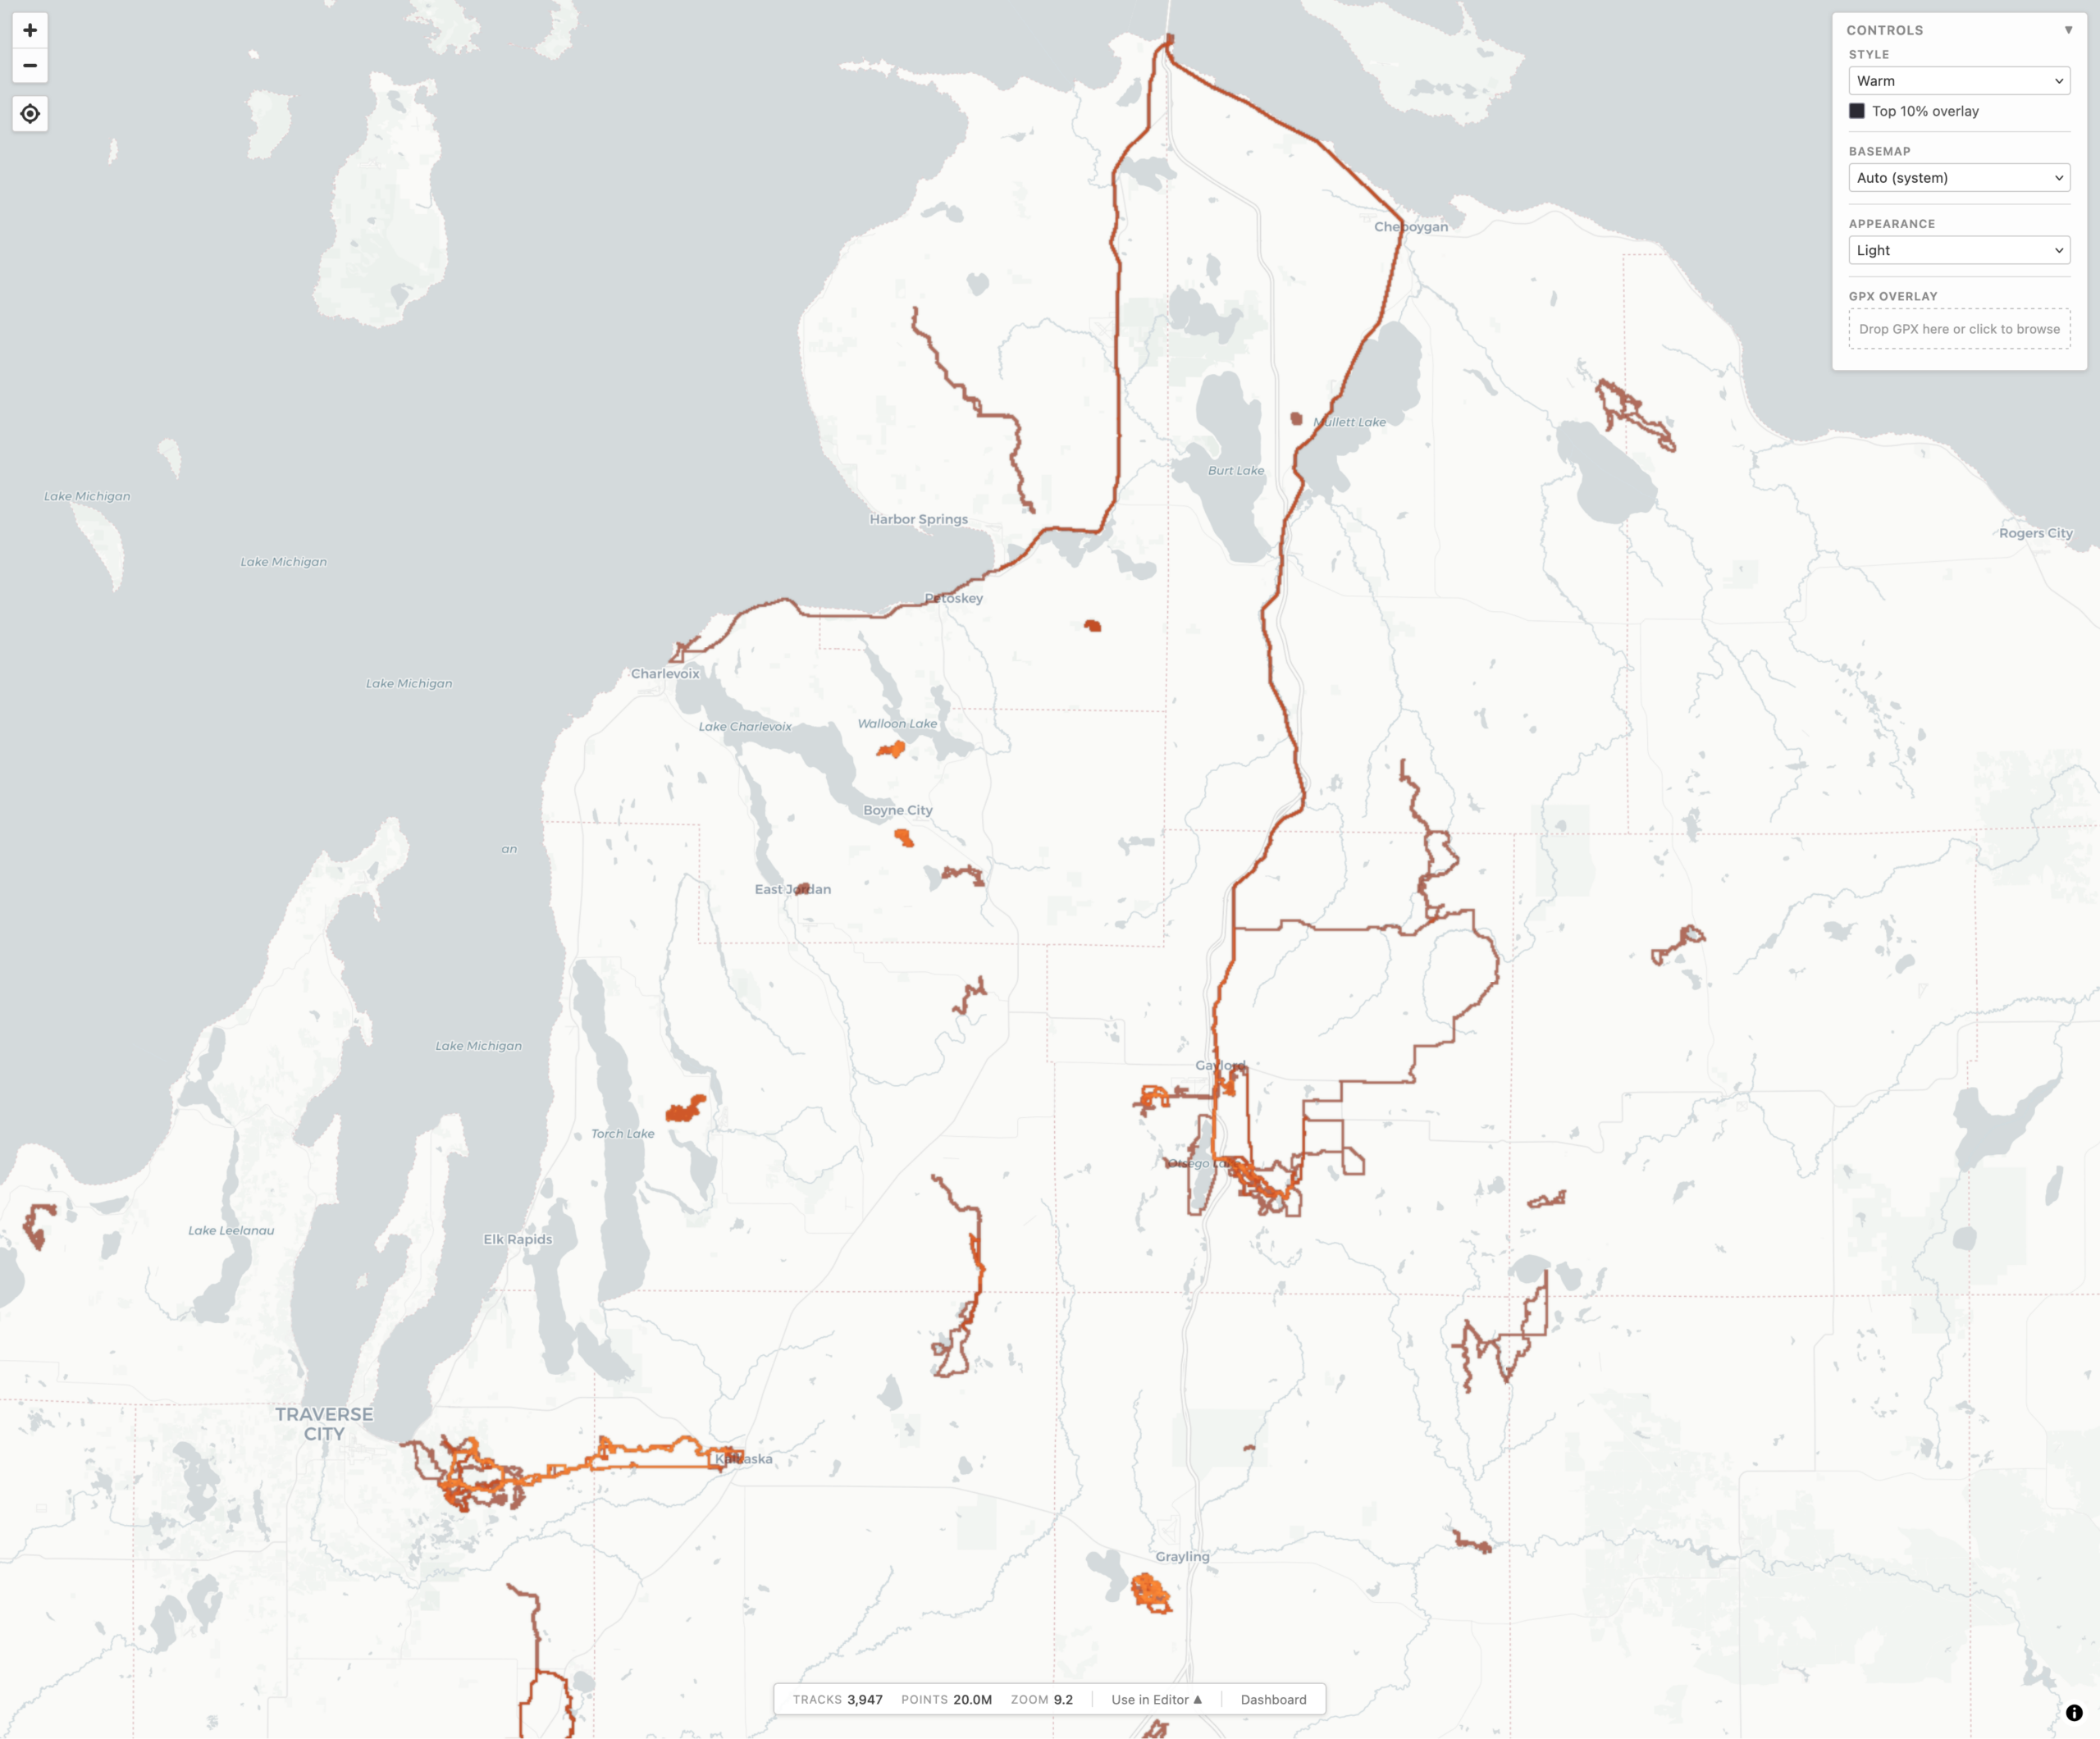
This is a single Docker container that uses a bunch of Python to import GPS data files (.FIT, .GPX, .TCX), imports, deduplicates, and renders a complete set of XYZ tiles. It then makes them available via HTTP (for display in a slippy map or something like JOSM) or exports them to a PMTiles file for simple hosting. And it has a built-in slippy map viewer/data manager and a couple bundled viewers for completely static hosting (example).
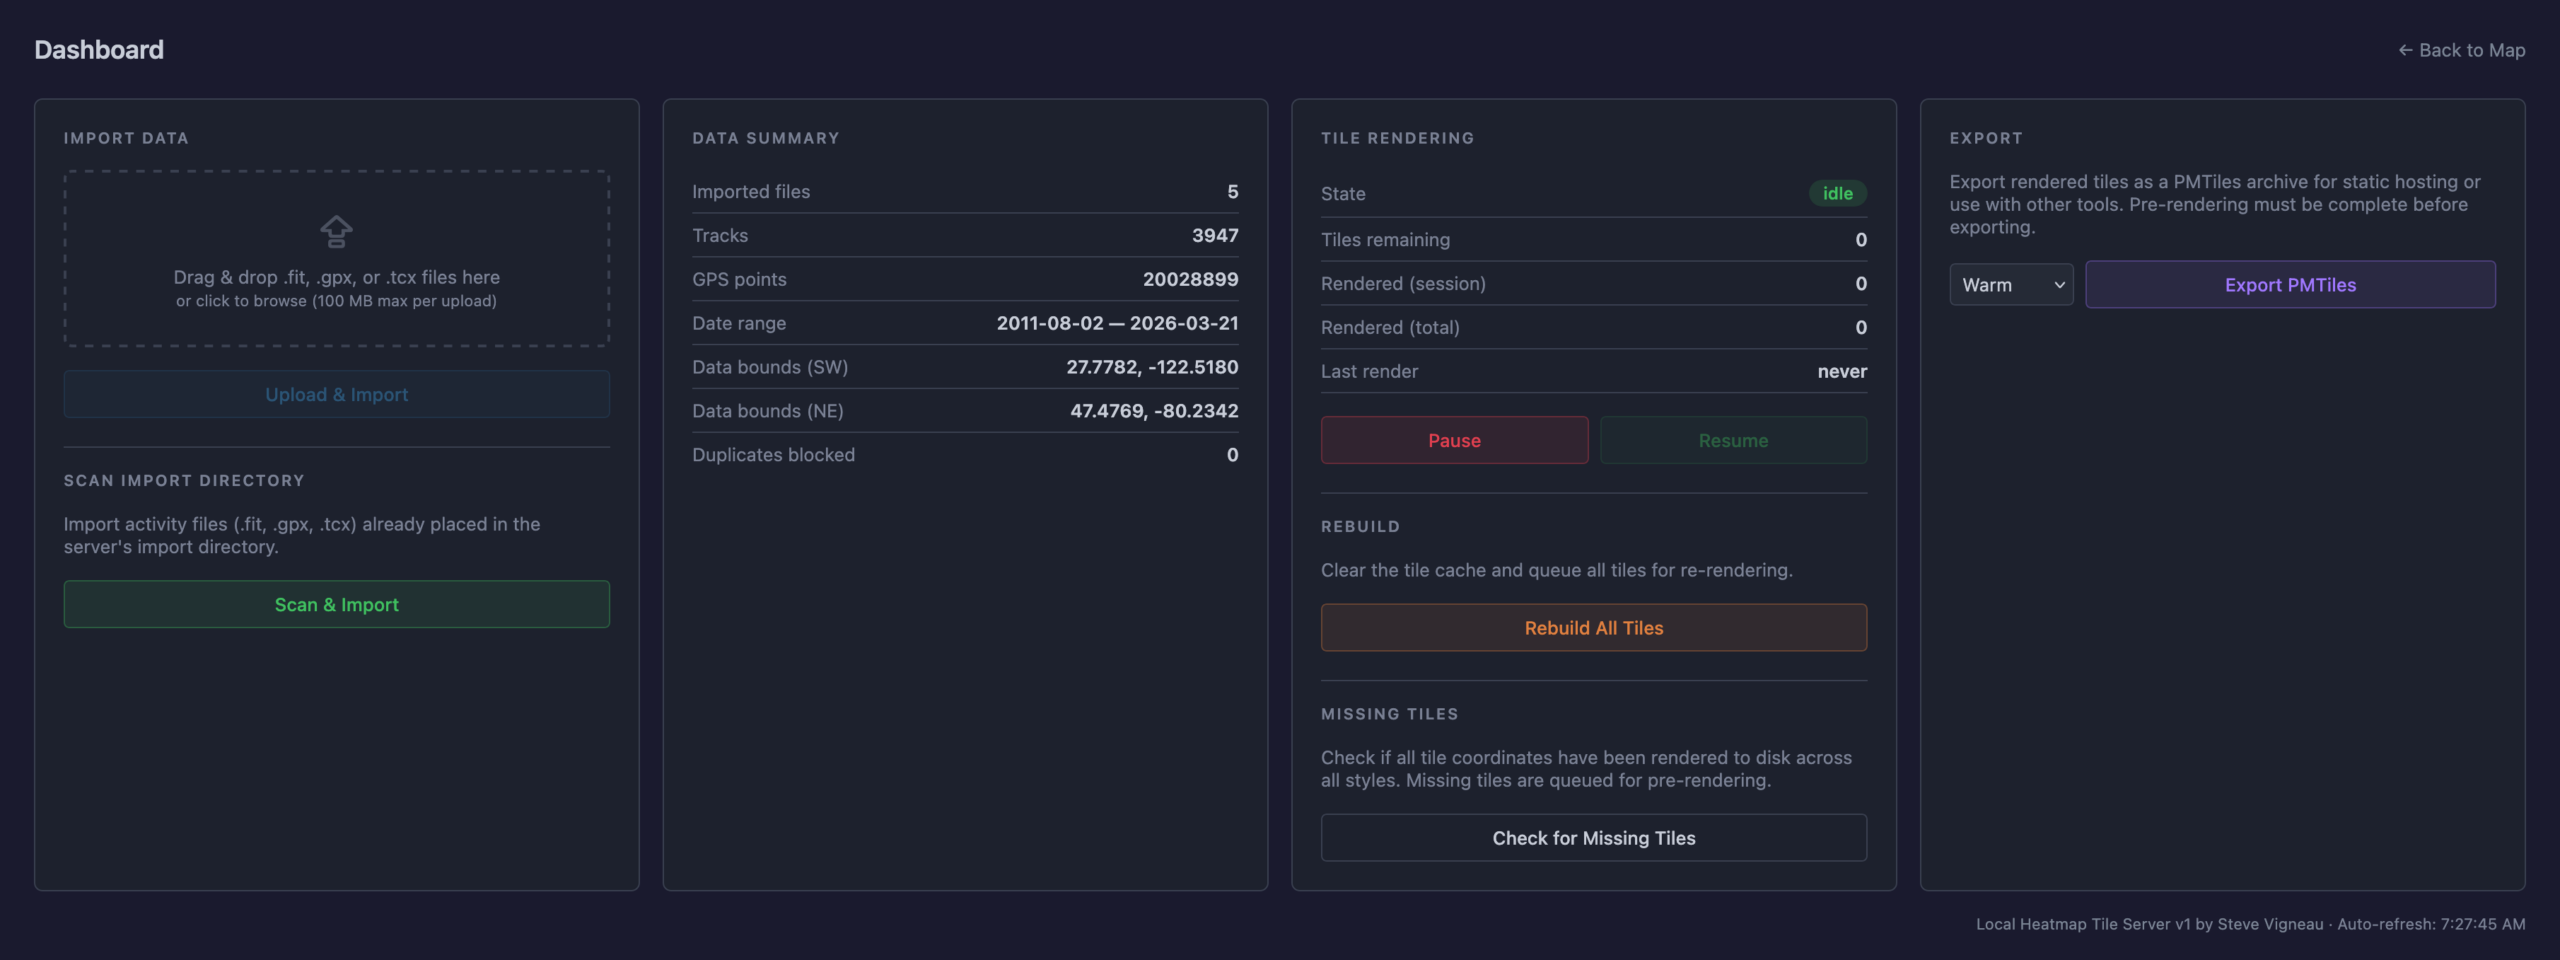
The Python webserver, uvicorn, isn’t the fastest nor great at caching, so the XYZ tiles are fronted with nginx to very quickly serve them from disk, only passing the request back to uvicorn and the Python stack for rendering if the tile isn’t present. Once the tiles are rendered they are cached very quickly served up solely by nginx, to the point where panning and zooming freely is seamless. (And yes, you can pre-render all tiles for optimal performance.)
It’s been tested on ~4000 track single-GPX files (exported from rubiTrack), ~4000 .FIT files directly from Garmin devices, and a bunch of different types of single GPX files. And… it seems to work!
The file inputs (FIT, TCX, GPX) aren’t special and parsers have existed for a long time. Nothing about heatmaps is new. Tile rendering isn’t new. Tile serving isn’t new. Nor are web-based heatmaps from fitness tracker data. But it needed to be glued together to get something that works this way, and this type of development made it possible. And I learned something new about AI-assisted software development along the way. It’s sure an interesting new world with these tools.
And yes, beyond thinking about the features I had to do a lot of nudging along the way.
Some major bugs that were encountered were getting cross-tile heatmap brightness correct, missing cross-tile data, tiles not rendering properly when called via different ways, moving to a faster web server so panning the map felt smooth, and a whole lot of tweaking of brightness and line thickness and blur and such at different zoom levels so it’d feel nice to use, noticing and dealing with malformed XML in GPXs…
But this was nudging via prompts and having a bit of an idea what it was doing, not coding. Which is what’s so weird and new to me. It’s like directing a team of pretty-decent junior devs.
And the end result is something I’ve wanted for a while. And now it exists. (And no, none of this post was written by any AI tool.)