Four years after my post on doing network captures on macOS with Process ID, Wireshark 4.6.0 has been released which includes support for parsing this extra metadata, including the process info.
So how do you do it? Easy! You just need the pktap interface parameter.
From the tcpdump(1) man page:
Alternatively, to capture on more than one interface at a time, one may use “pktap” as the interface parameter followed by an optional list of comma separated interface names to include. For example, to capture on the loopback and en0 interface:
tcpdump -i pktap,lo0,en0An interface argument of “all” or “pktap,all” can be used to capture packets from all interfaces, including loopback and tunnel interfaces. A pktap pseudo interface provides for packet metadata using the default PKTAP data link type and files are written in the Pcap-ng file format. The RAW data link type must be used to force to use the legacy pcap-savefile(5) file format with a ptkap pseudo interface. Note that captures on a ptkap pseudo interface will not be done in promiscuous mode.
Therefore, we just need something like:
tcpdump -i pktap,en0 -w outfile.pcapngor
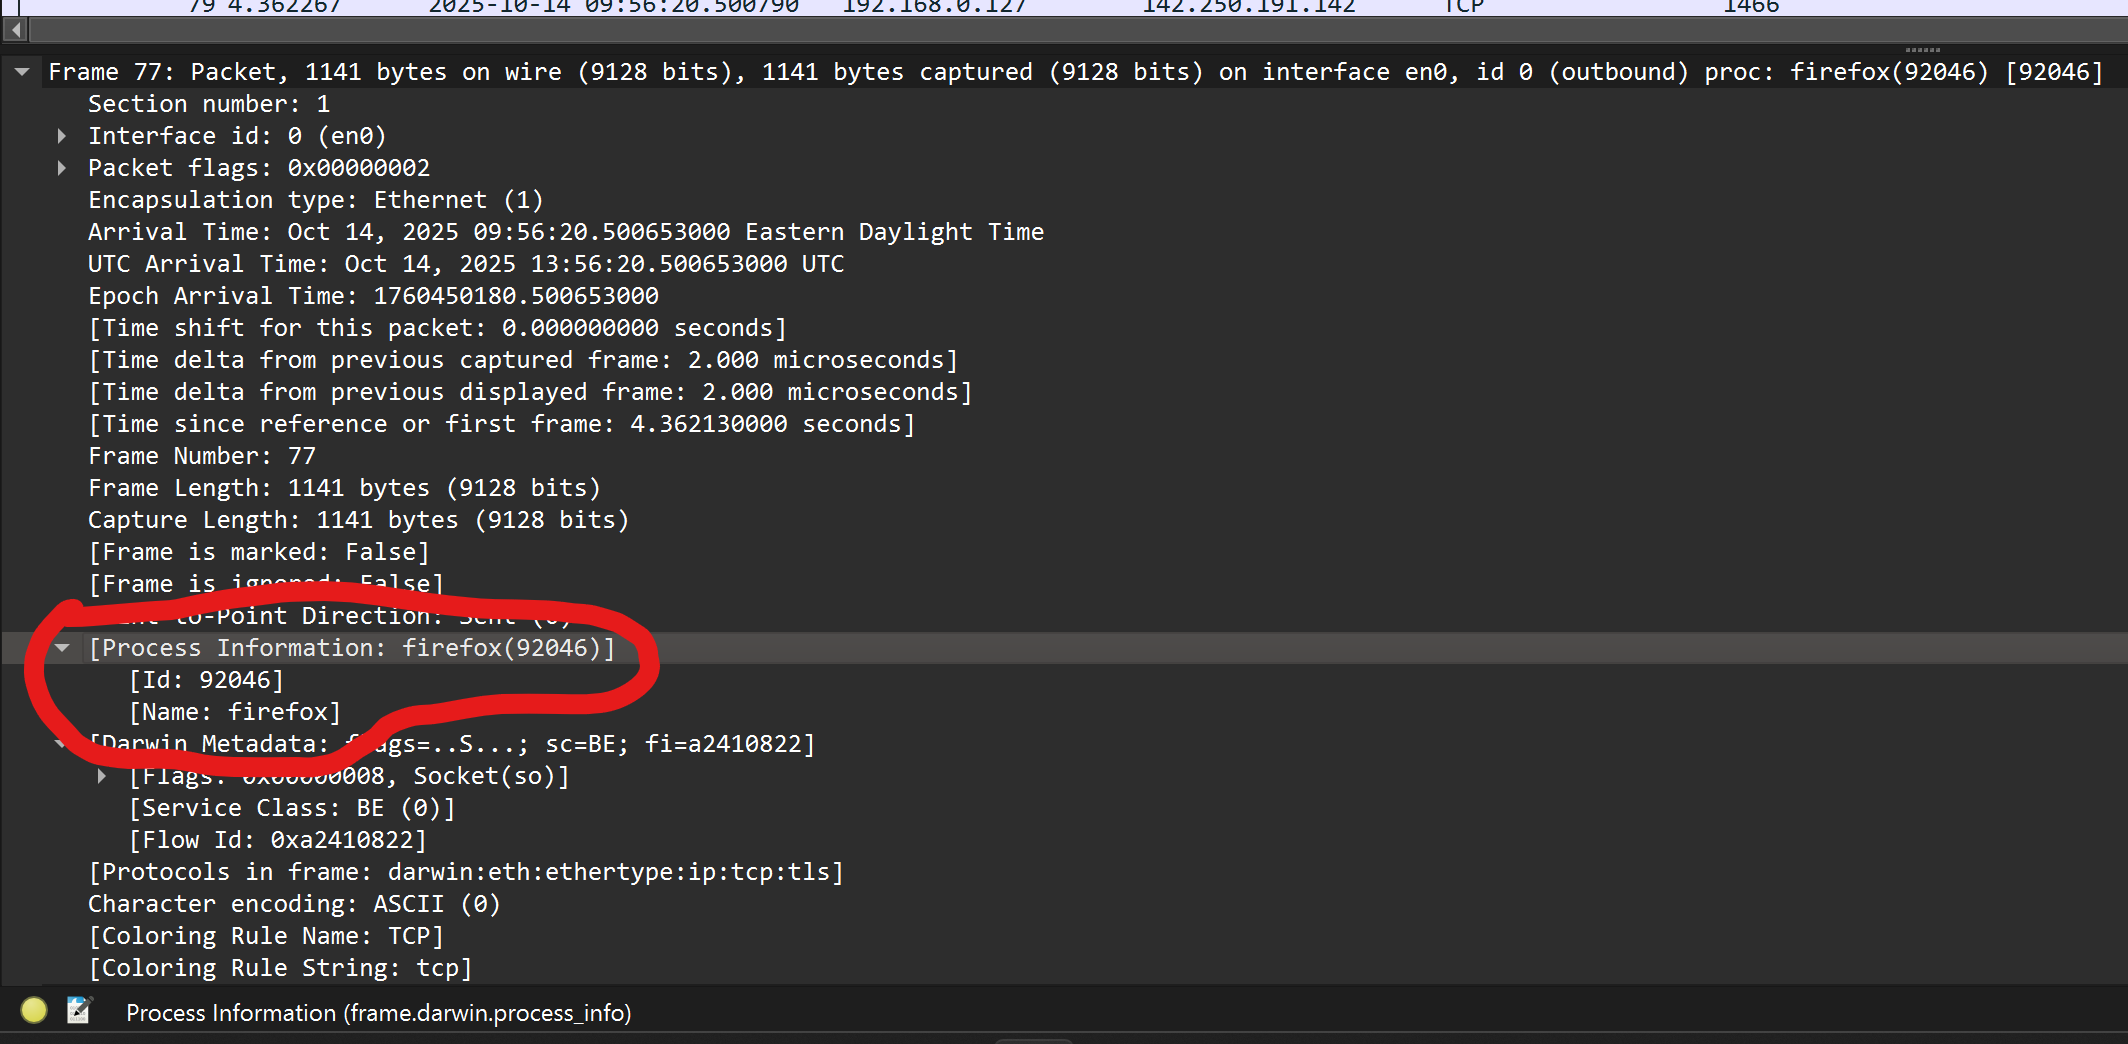
tcptump -i pktap,all host 192.168.0.6 -w outfile.pcapngAnd then open outfile.pcapng in Wireshark and under Frame → Process Information you can find the process name, PID, etc. (See screenshot above.)
Filtering can be done with frame.darwin.process_info as listed here. For example:
frame.darwin.process_info.pname == "firefox"or
frame.darwin.process_info.pid == 92046This is super helpful to figure out both what unexpected network traffic is being generated by and the inverse, what a process is doing on the network. And now thanks to Wireshark 4.6.0 it’s even easier.